Can social media read a by-election before the vote?
Since 19 September Qalu has followed the Brantford–Brant South federal by-election in the open, without taking a side. This is what the conversation looked like a month before polling day.
- posts, comments and articles
- 2,478
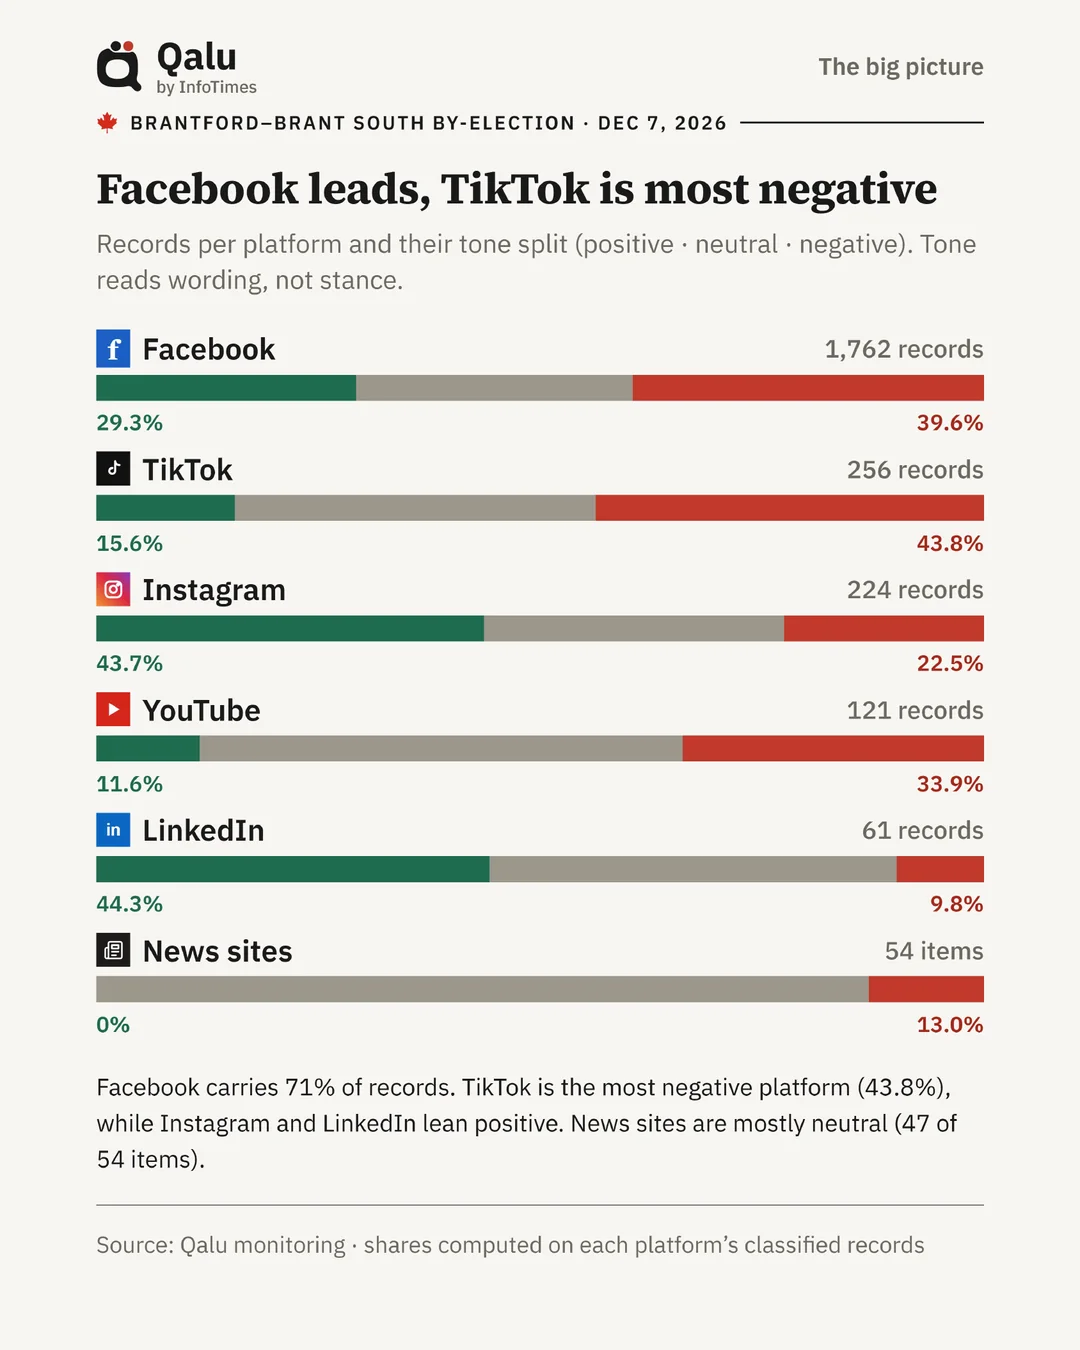
- of it on Facebook
- 71%
- records on the busiest day, 8 November
- 574
- news articles, against 2,174 comments
- 54
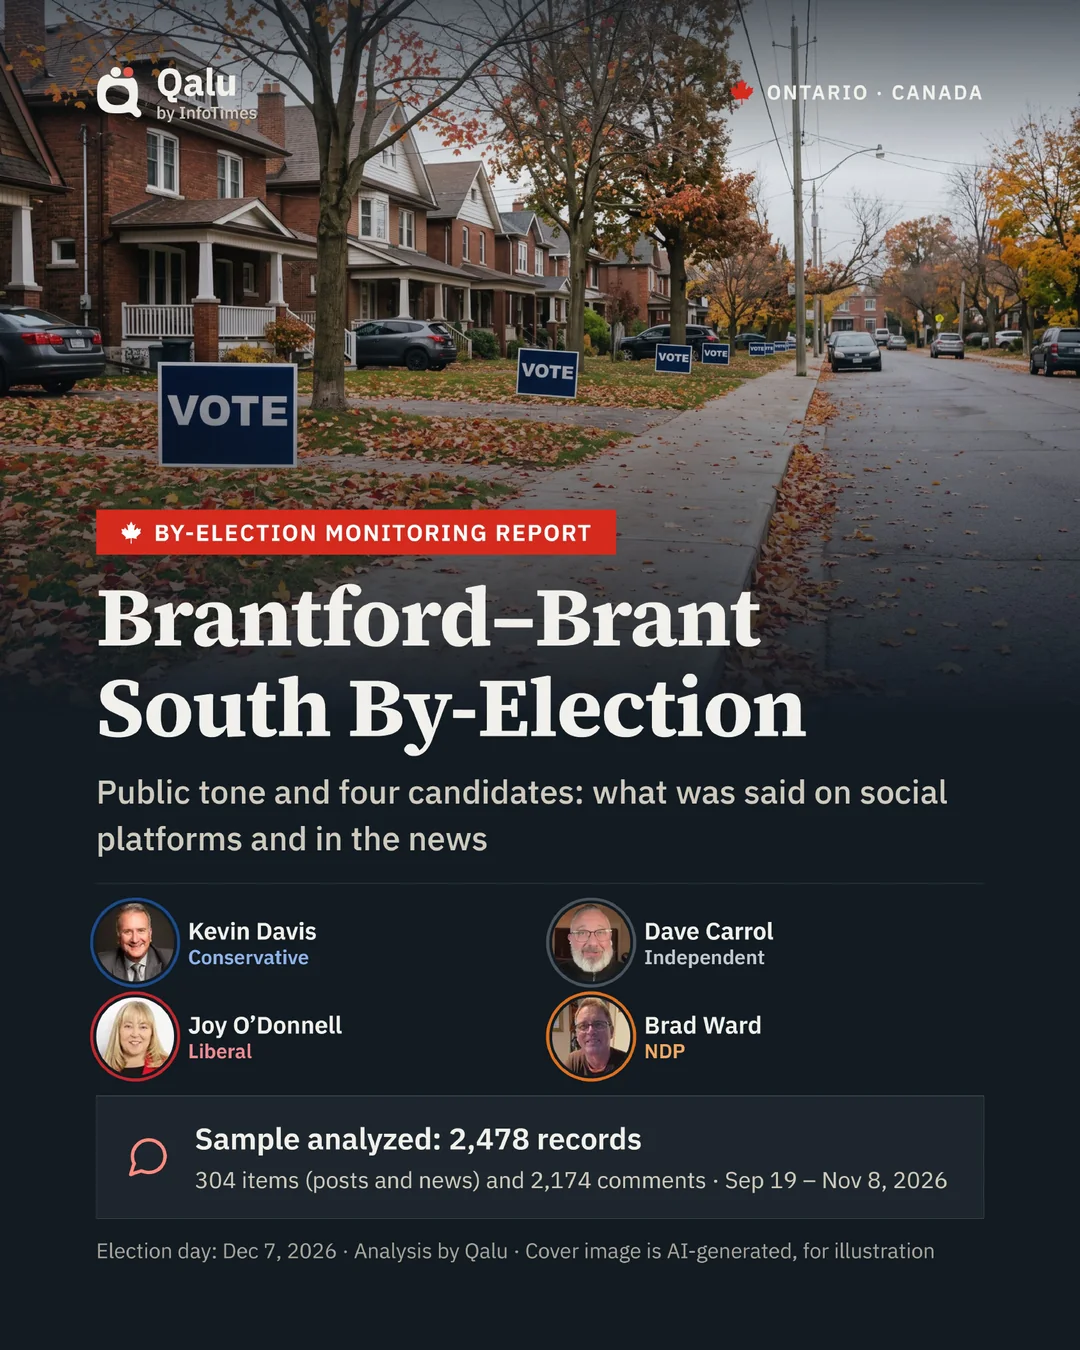
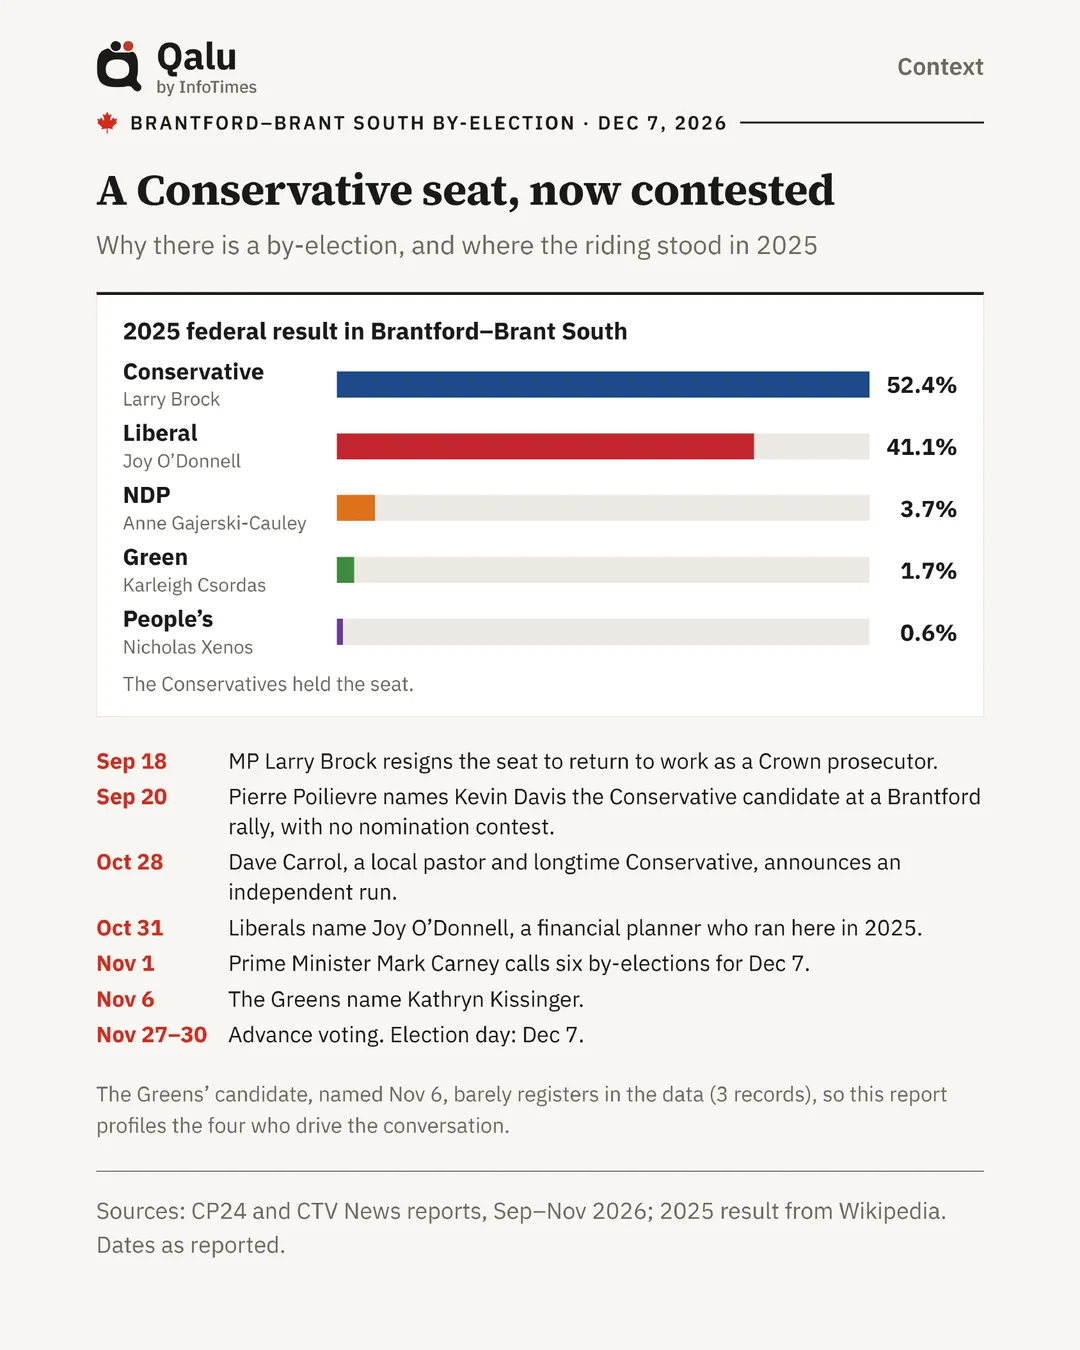
The report
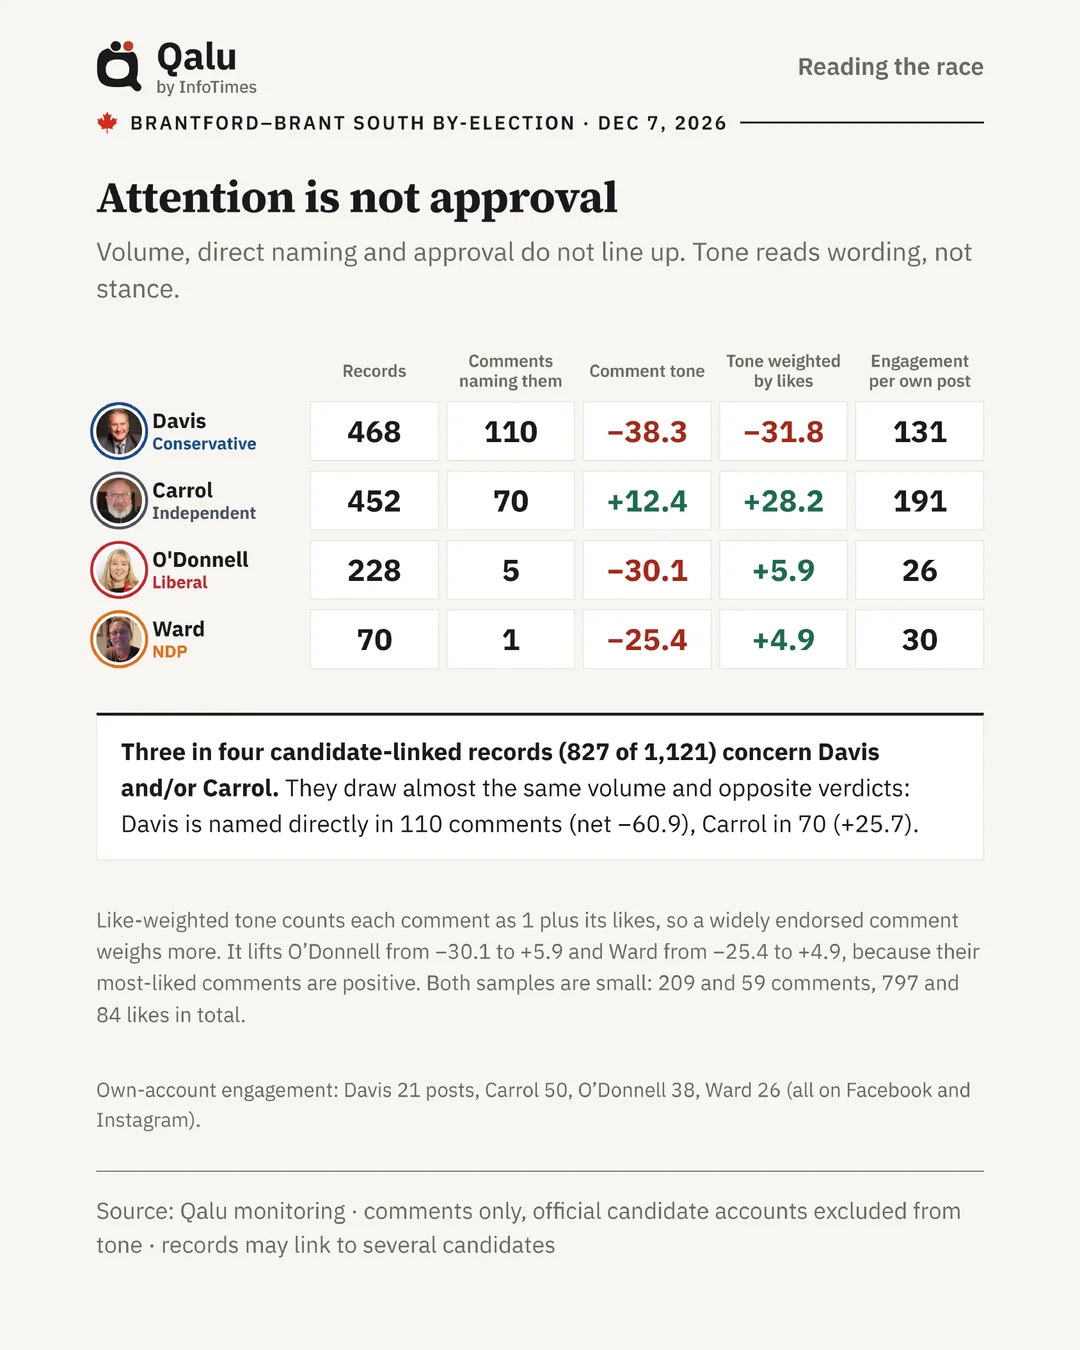
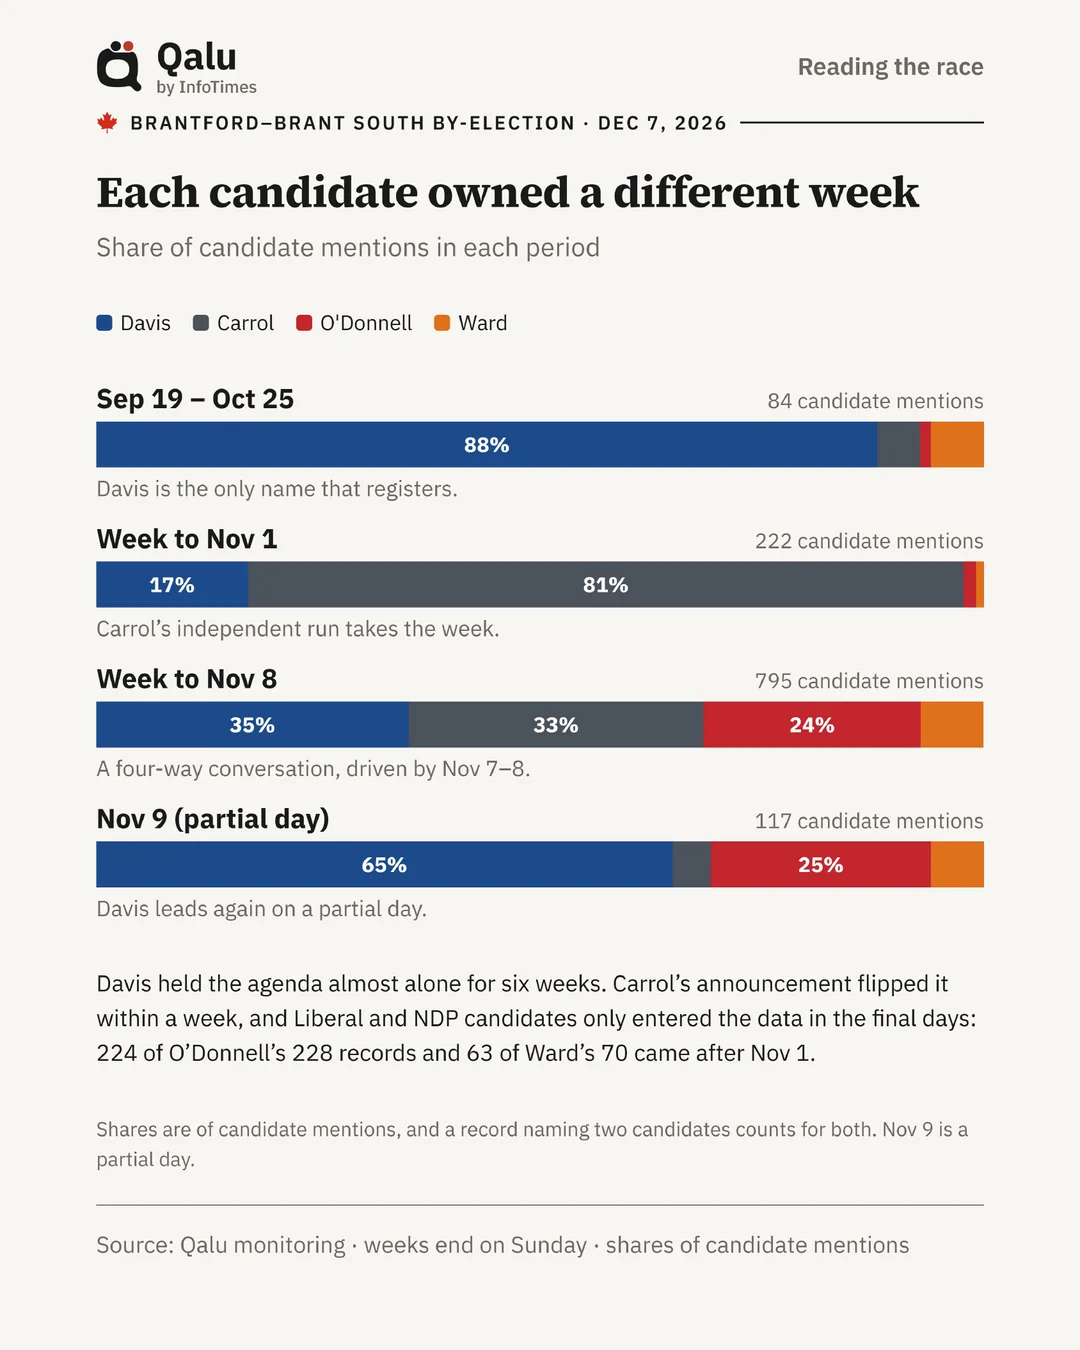
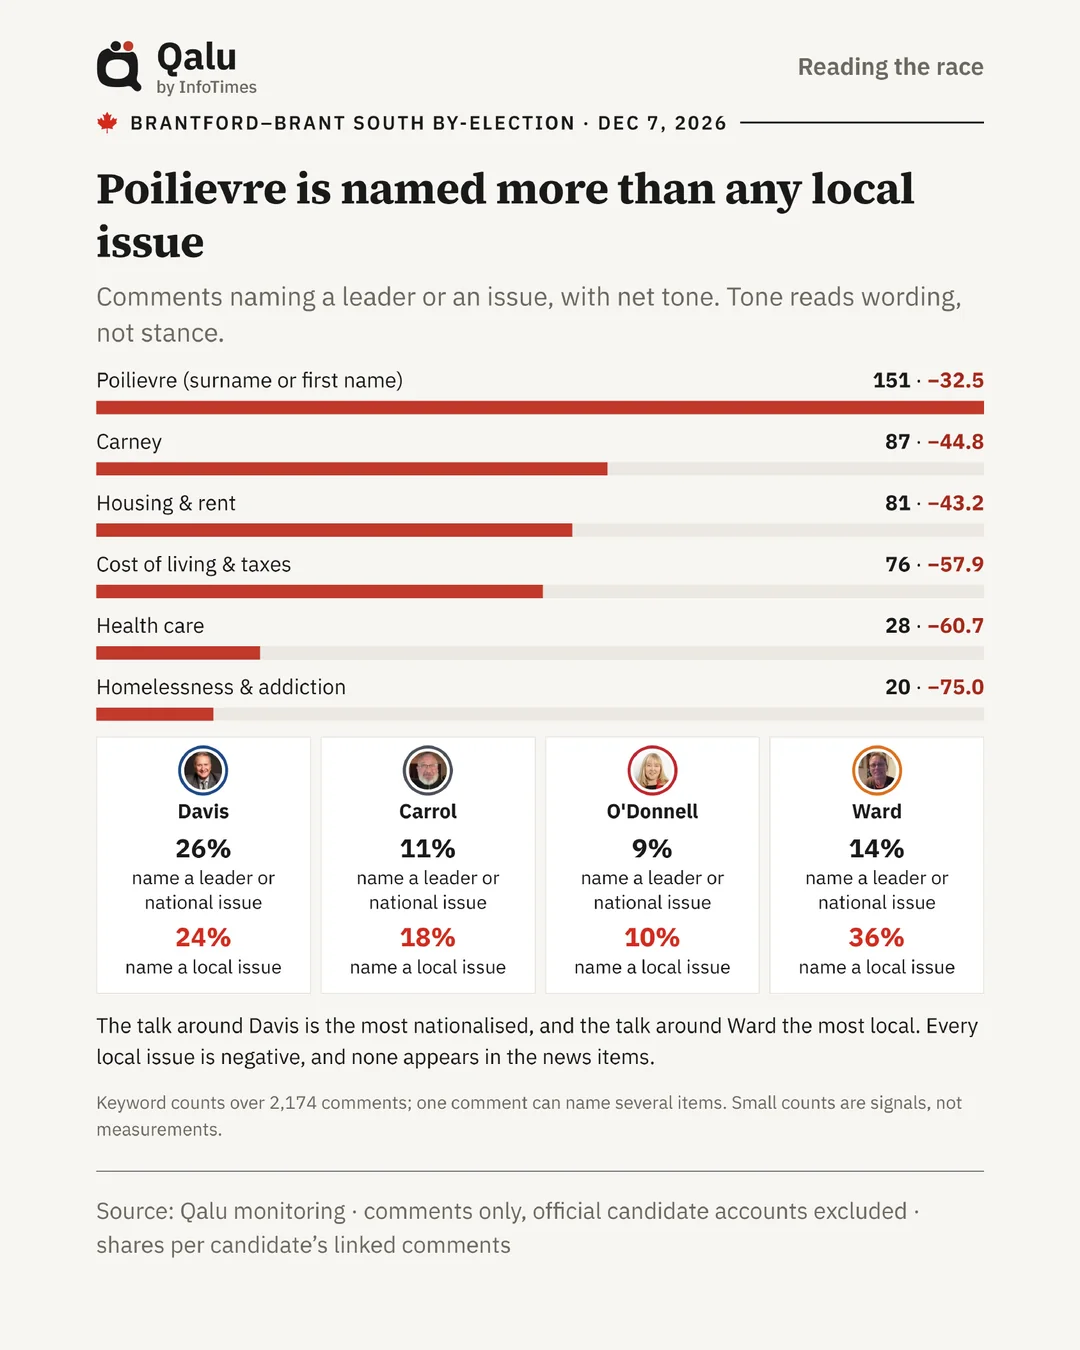
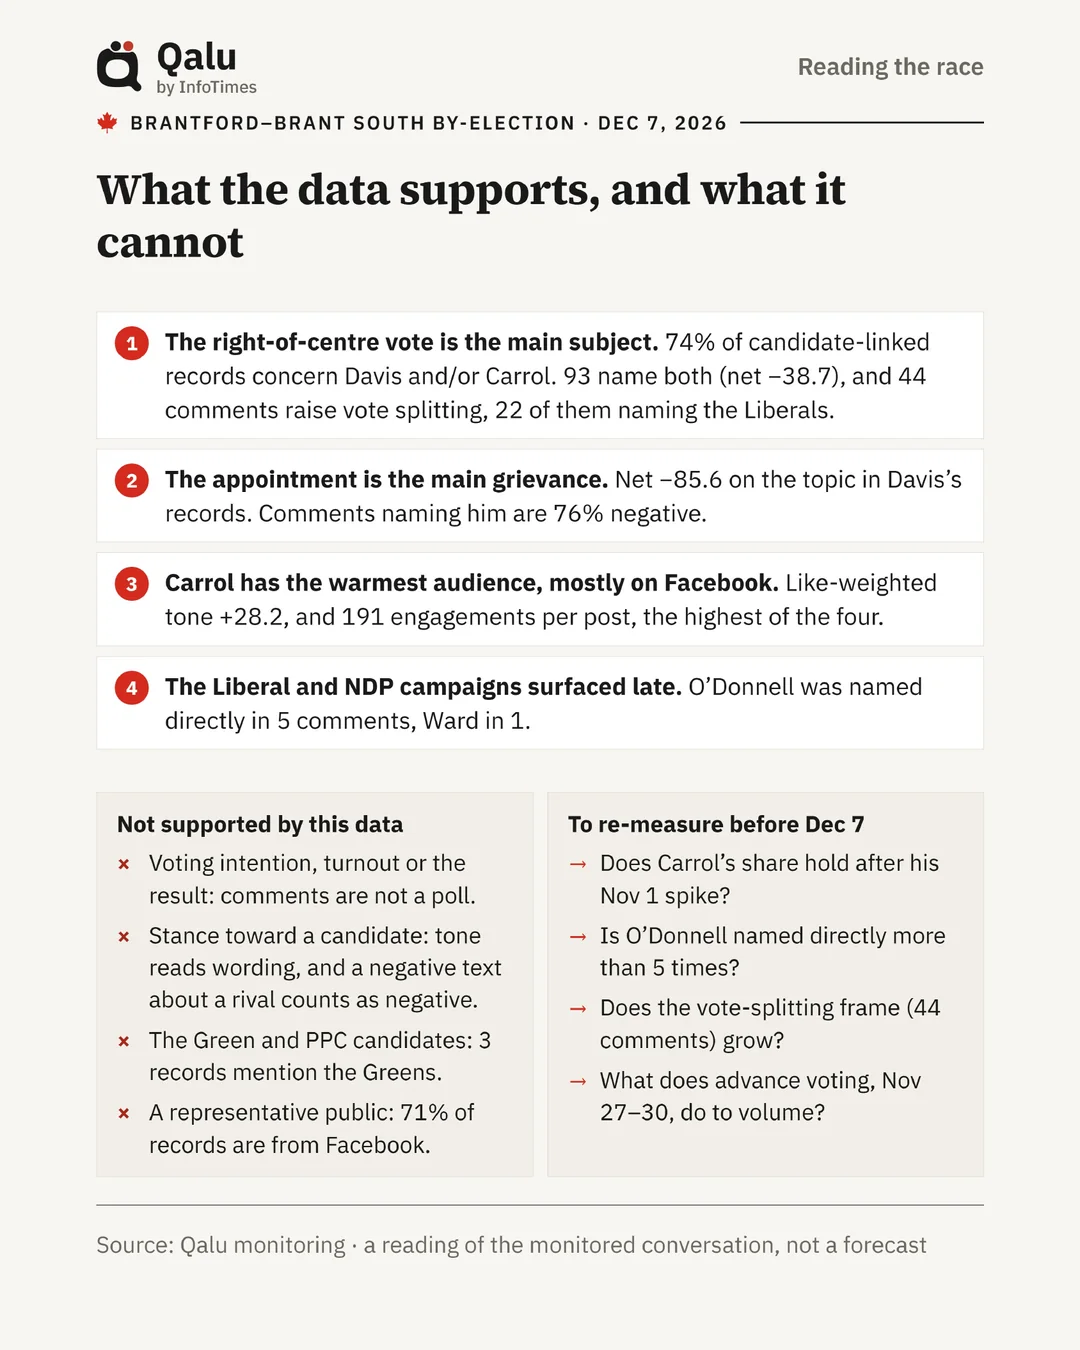
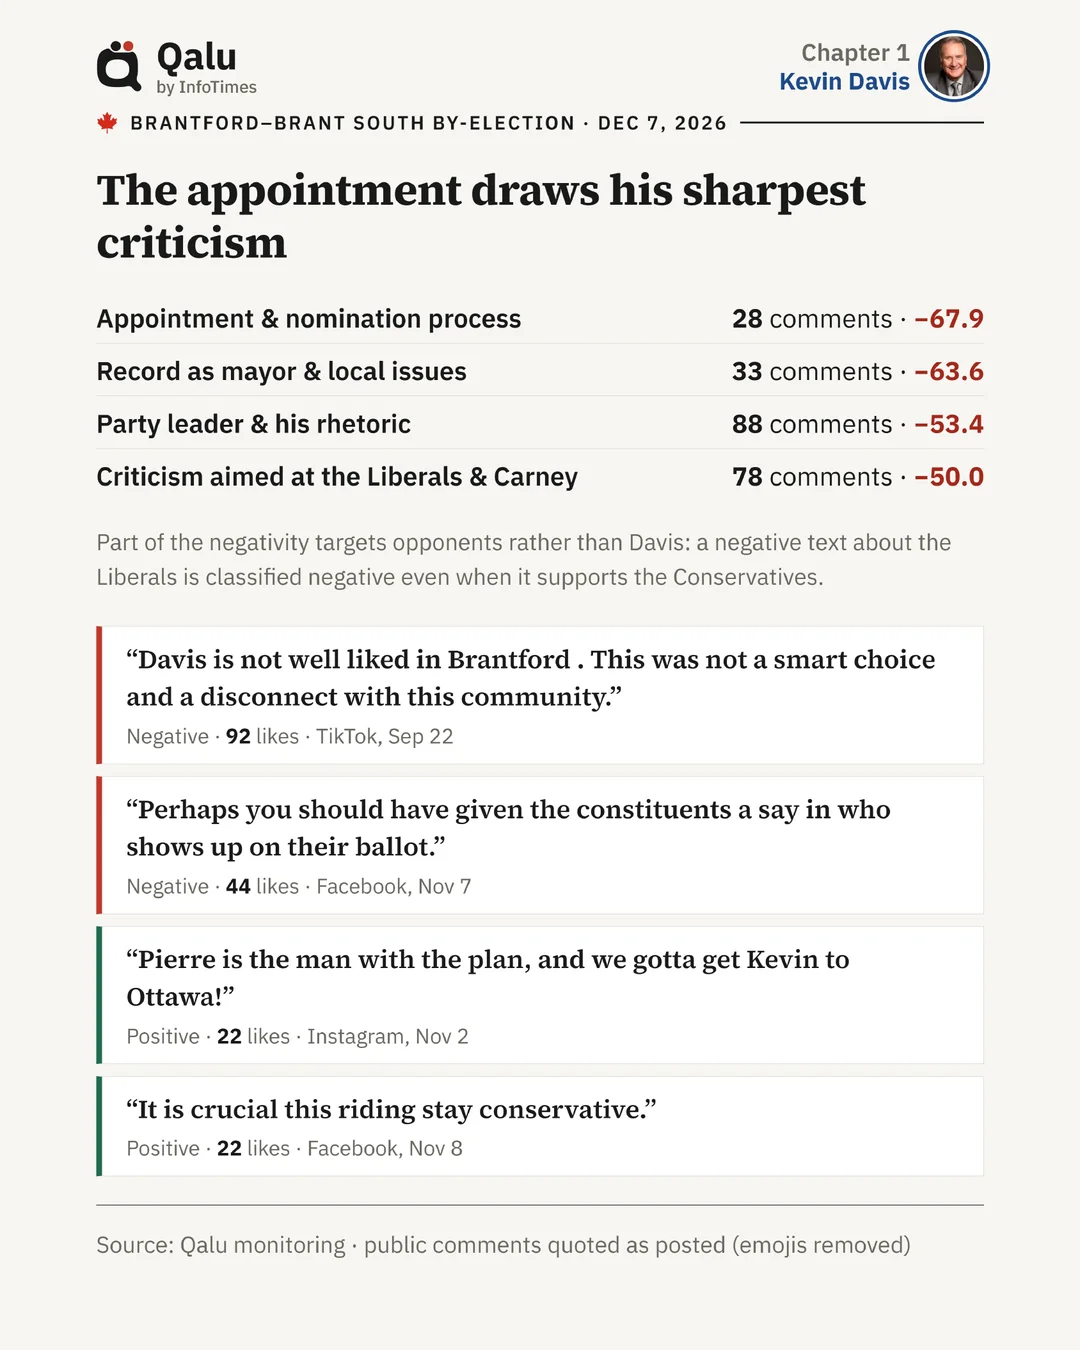
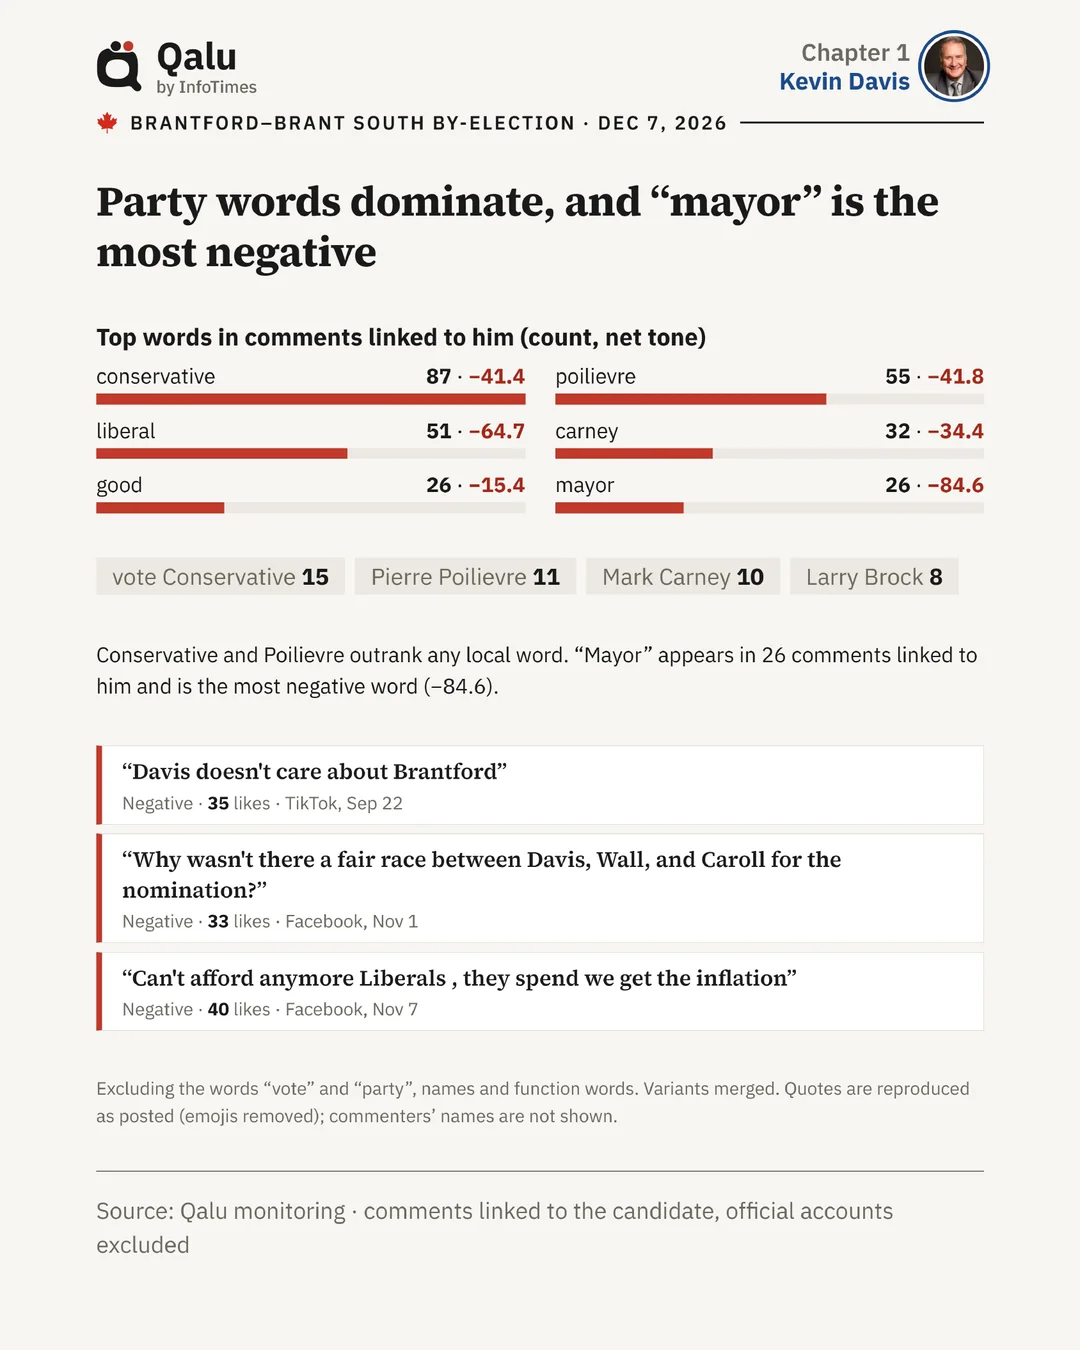
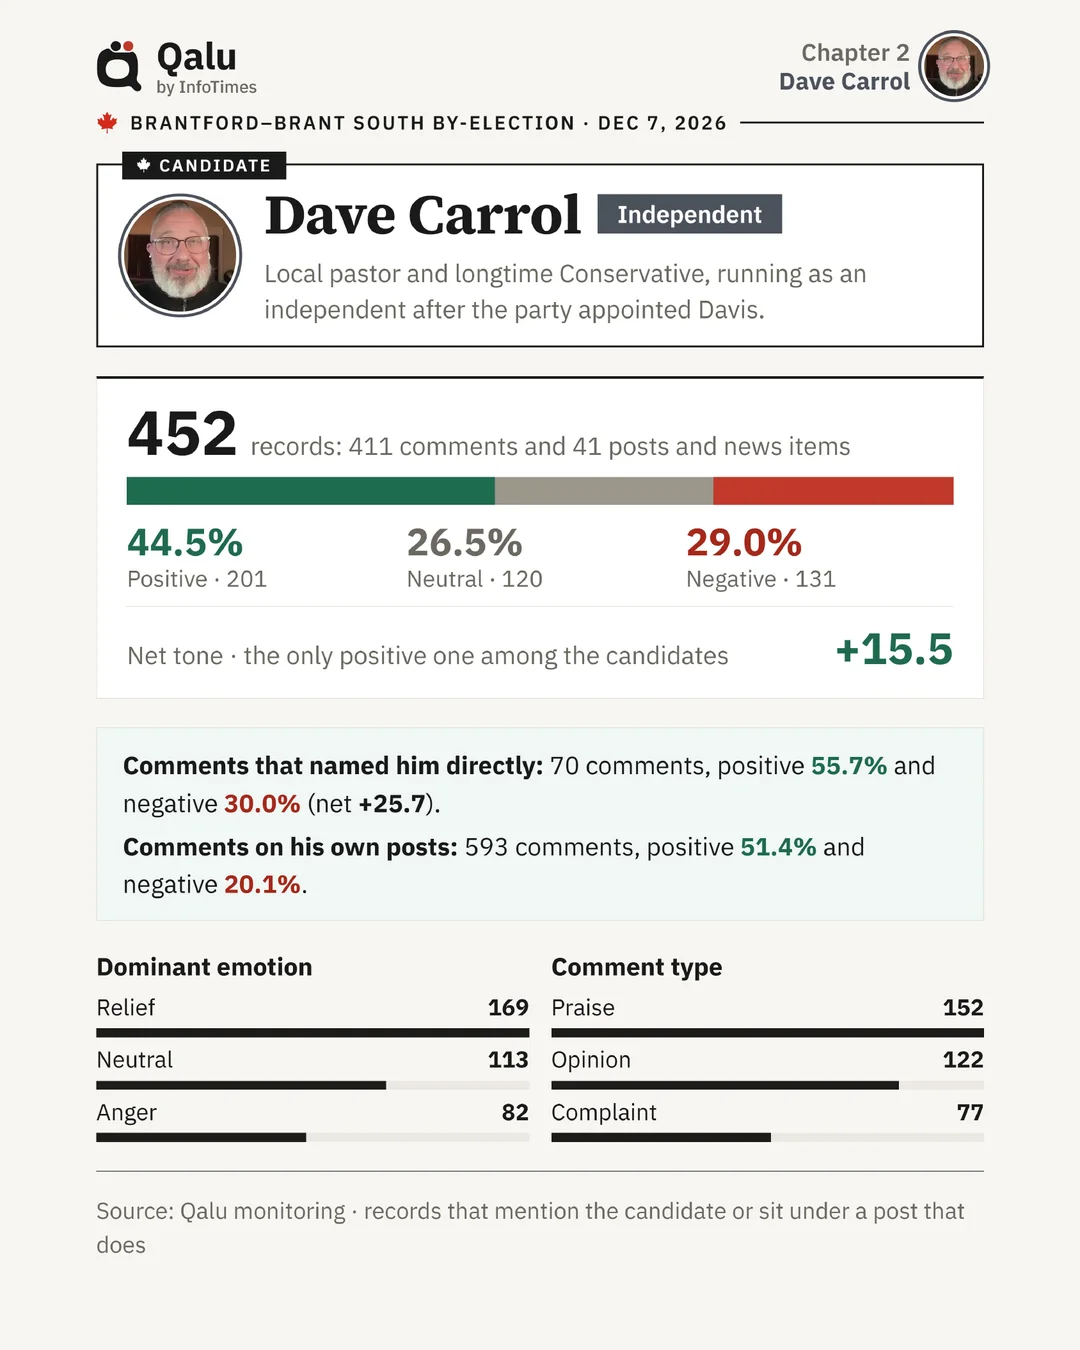
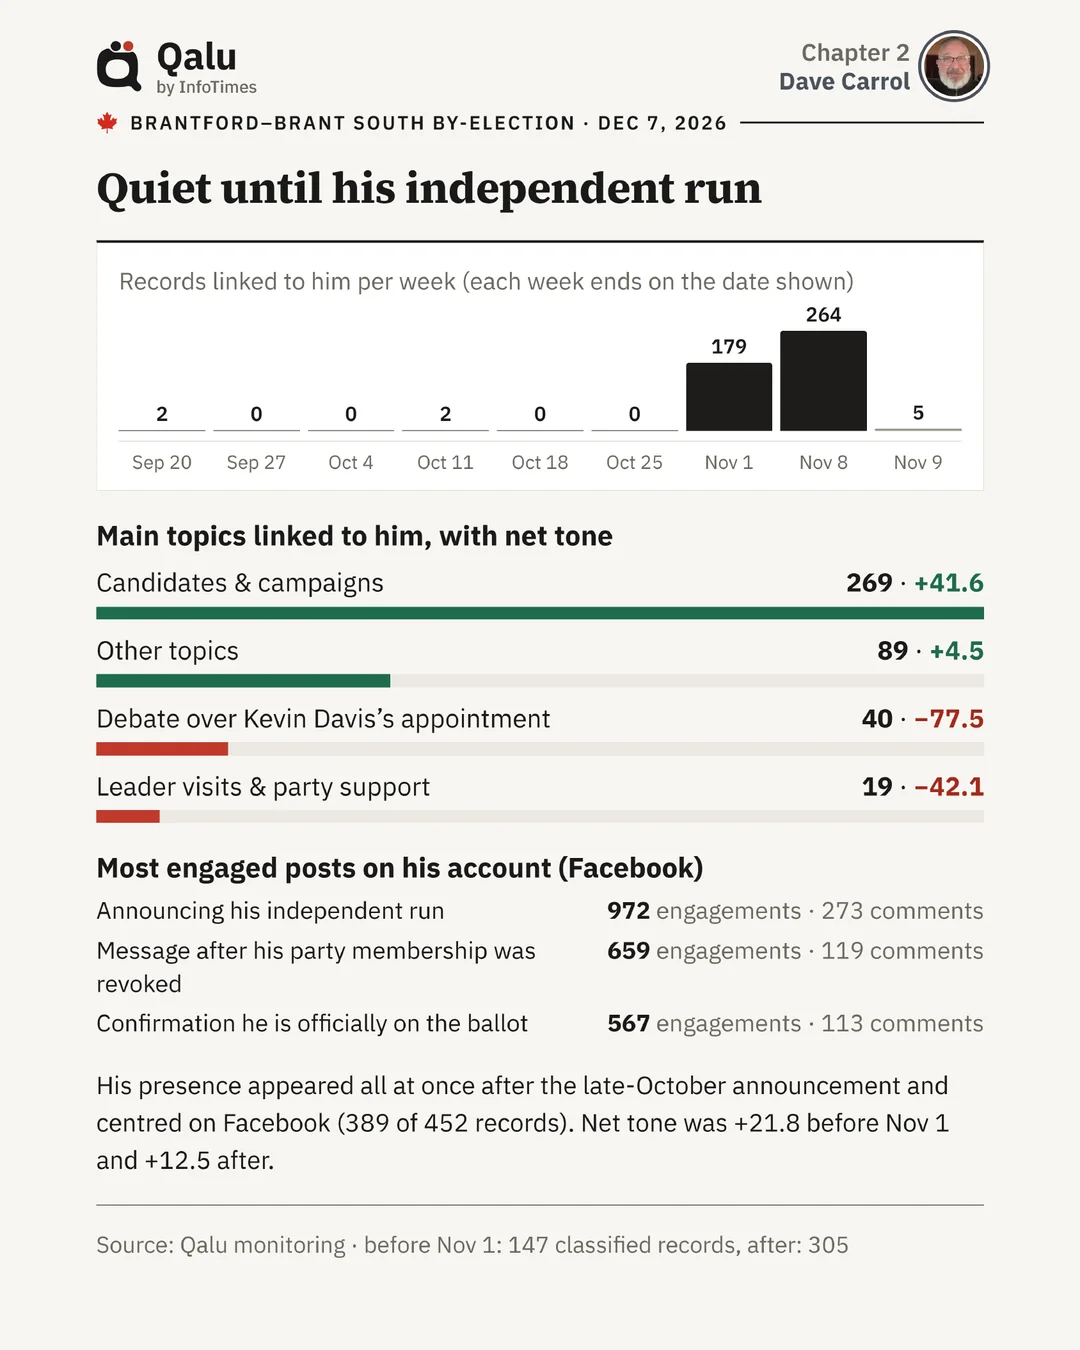
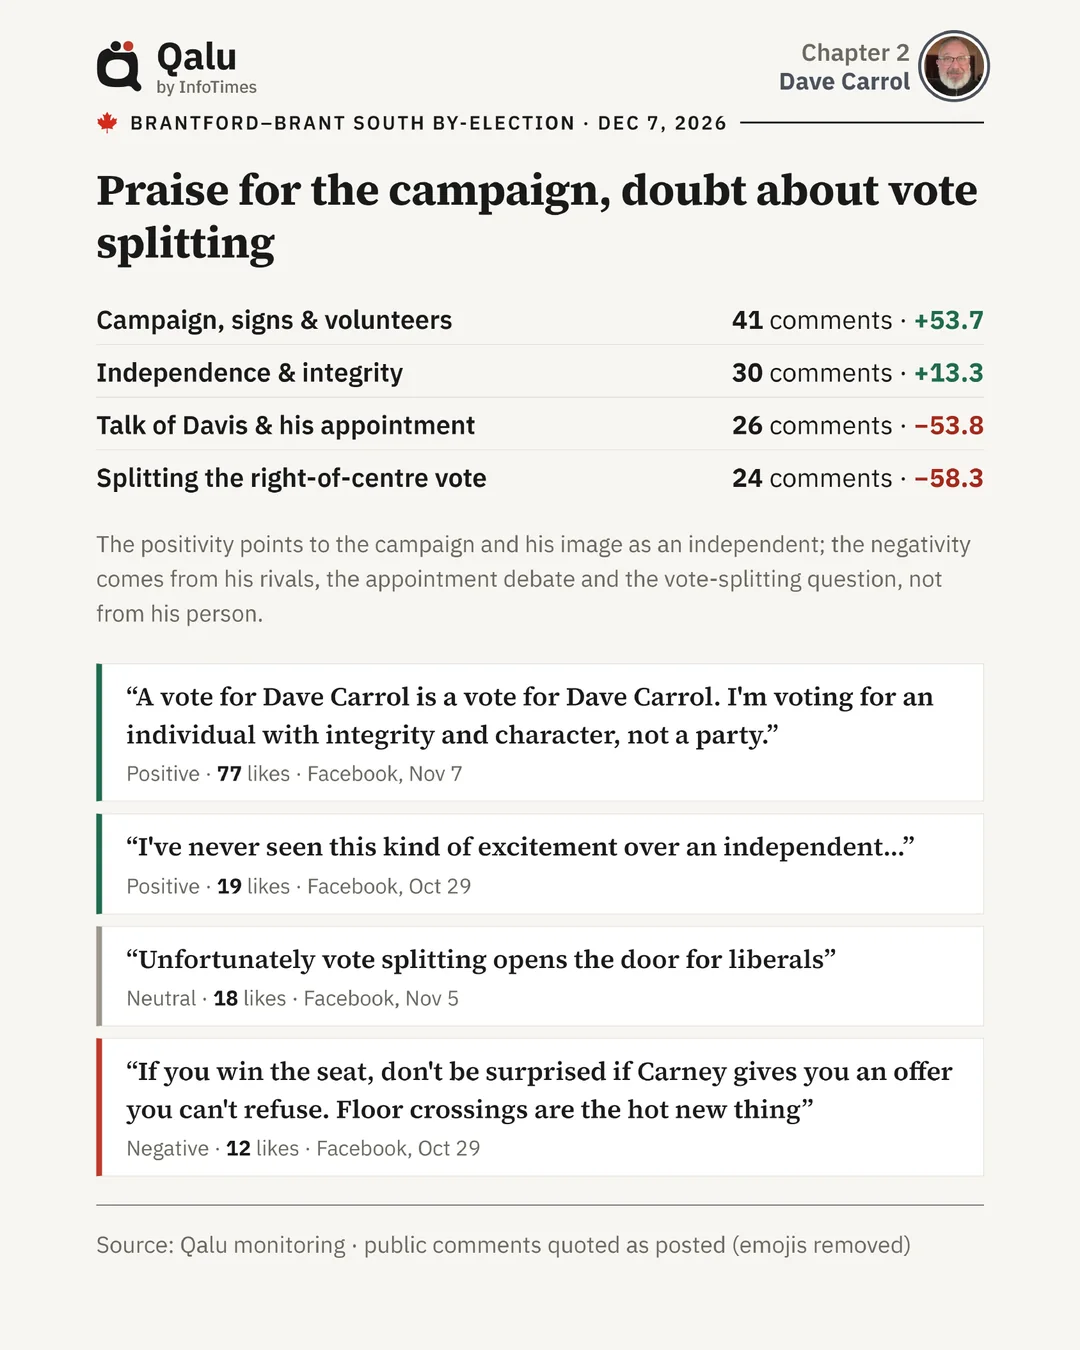
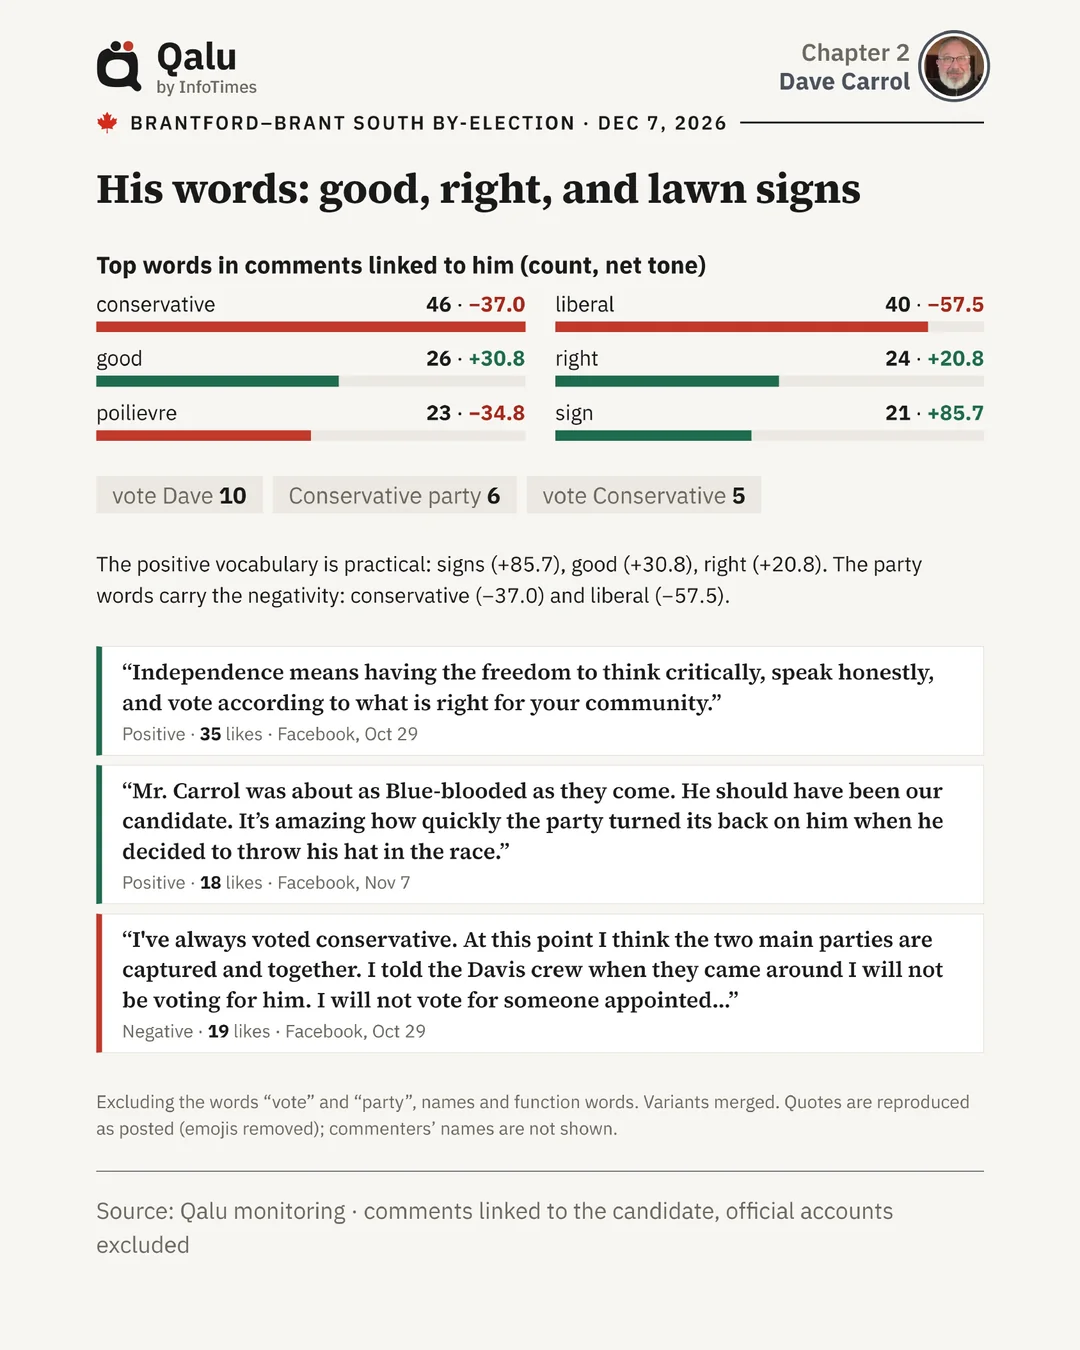
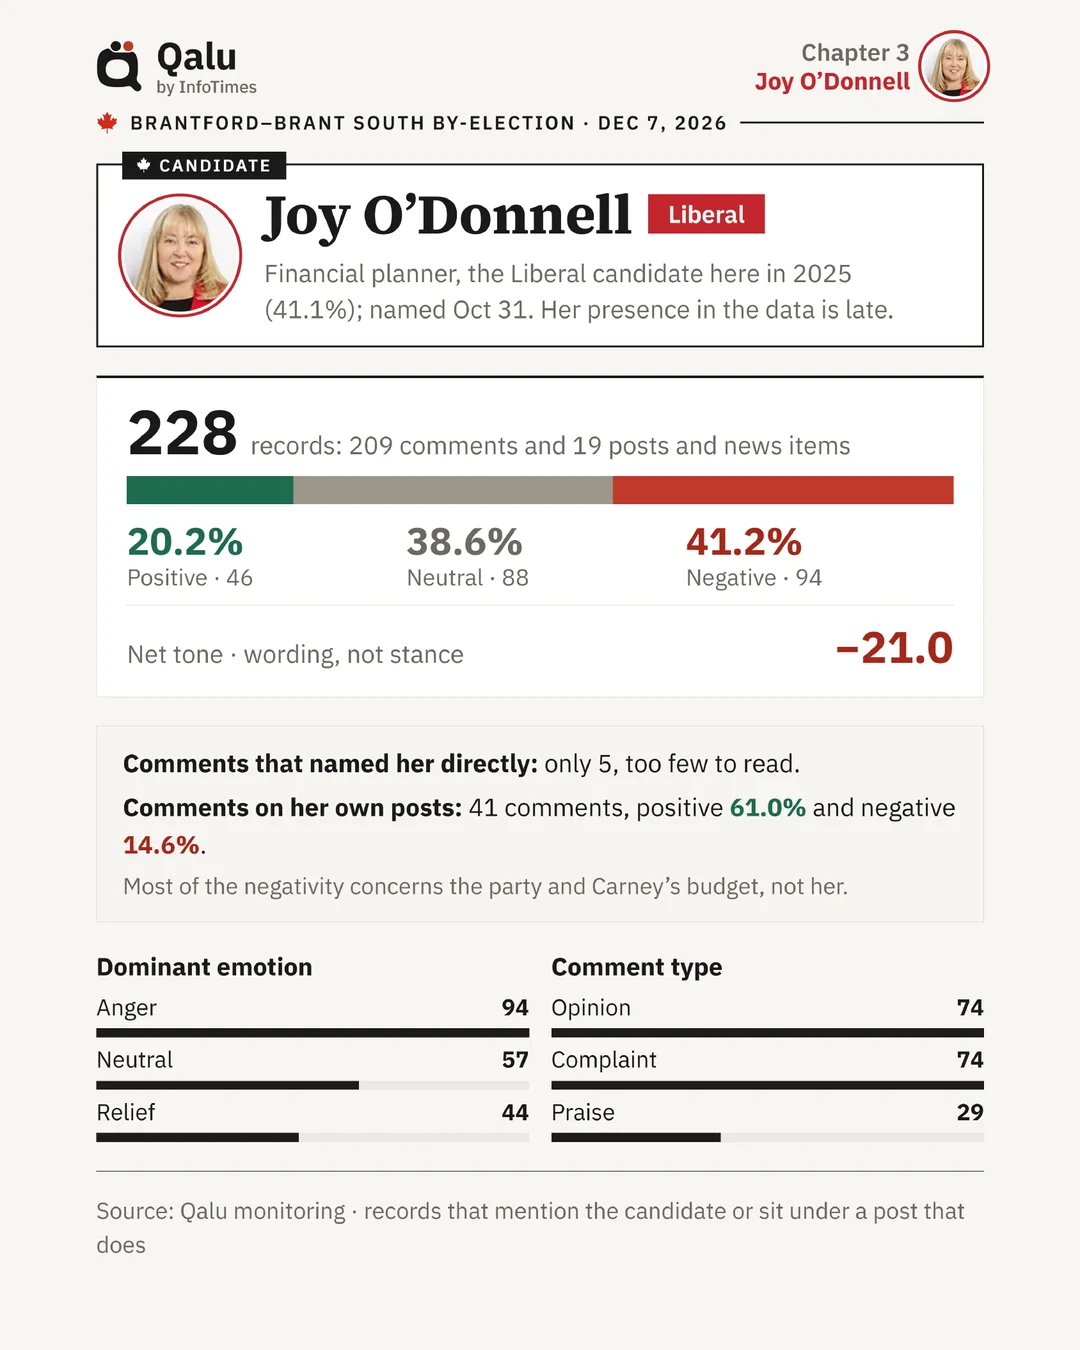
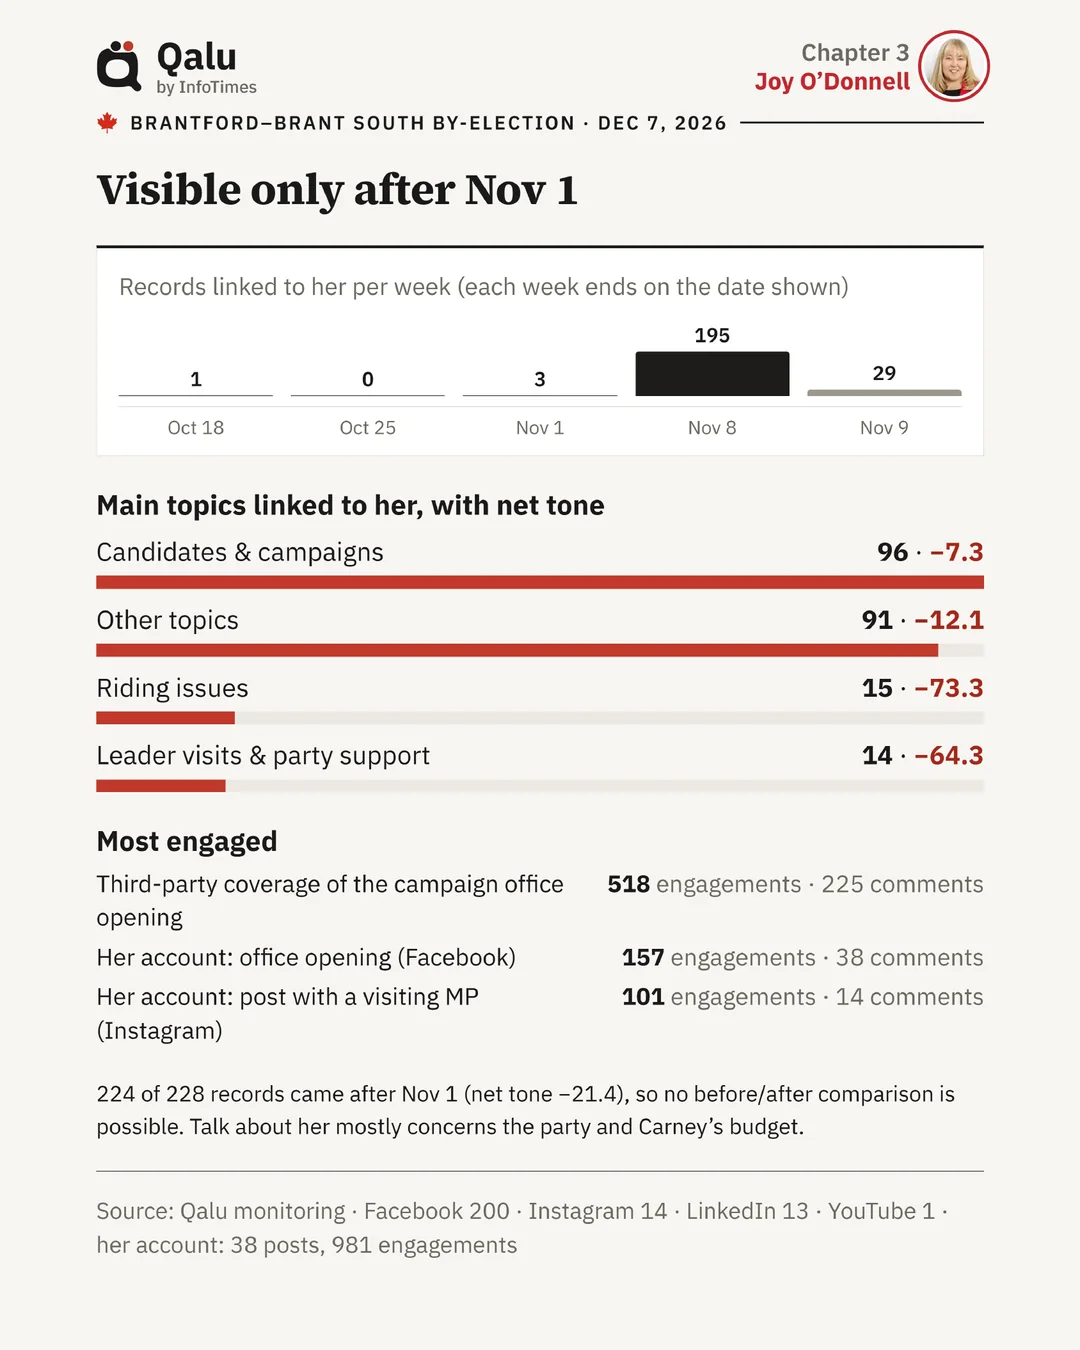
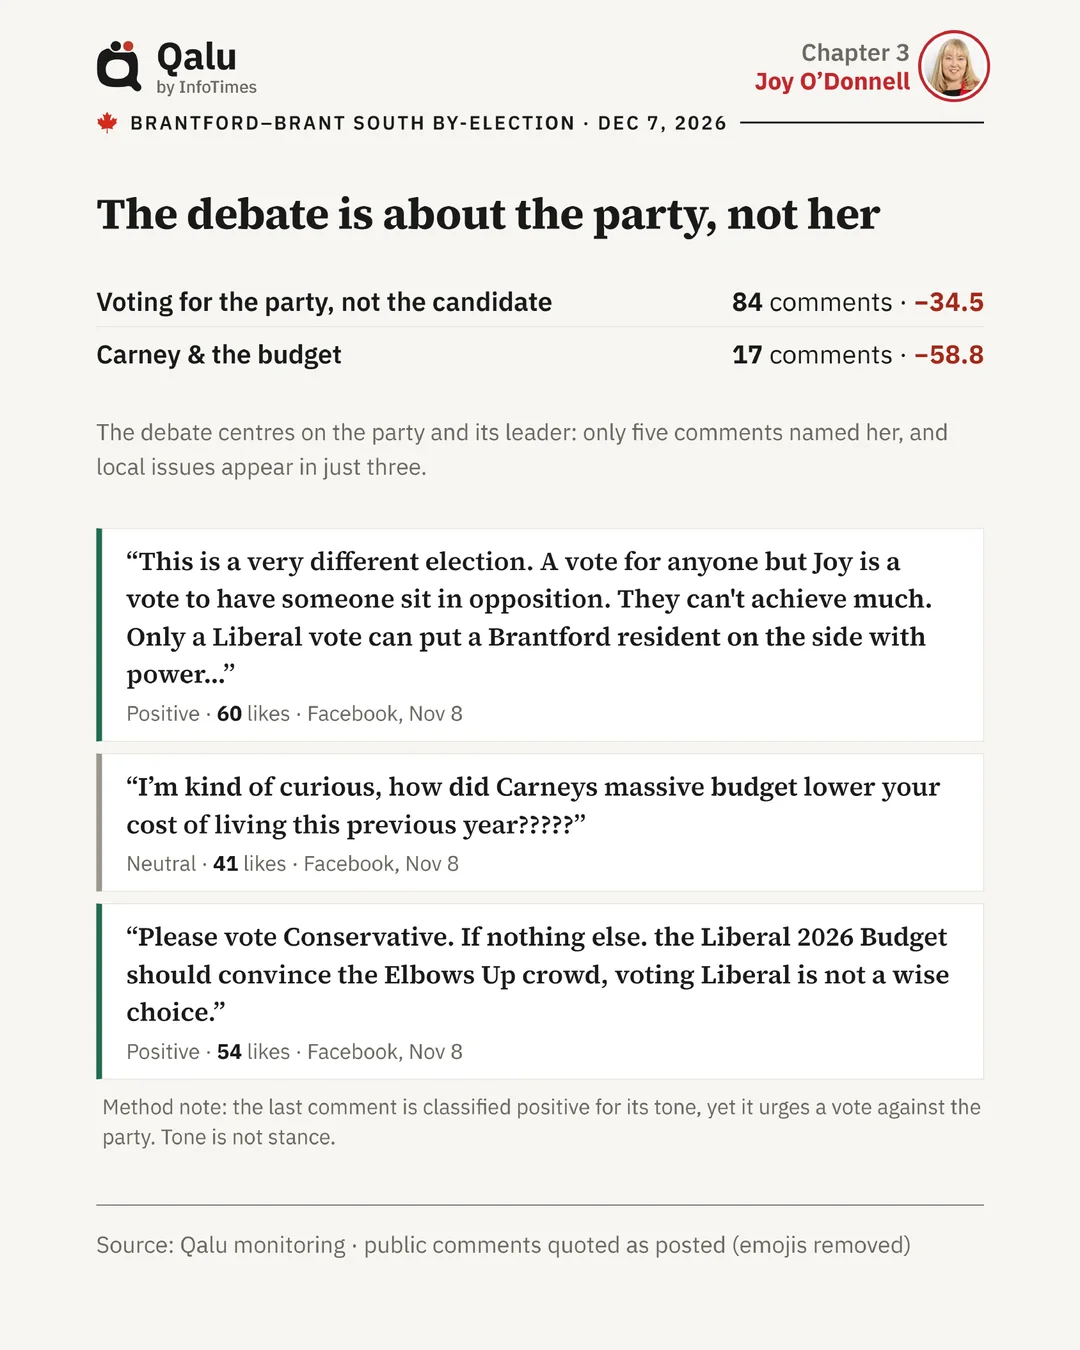
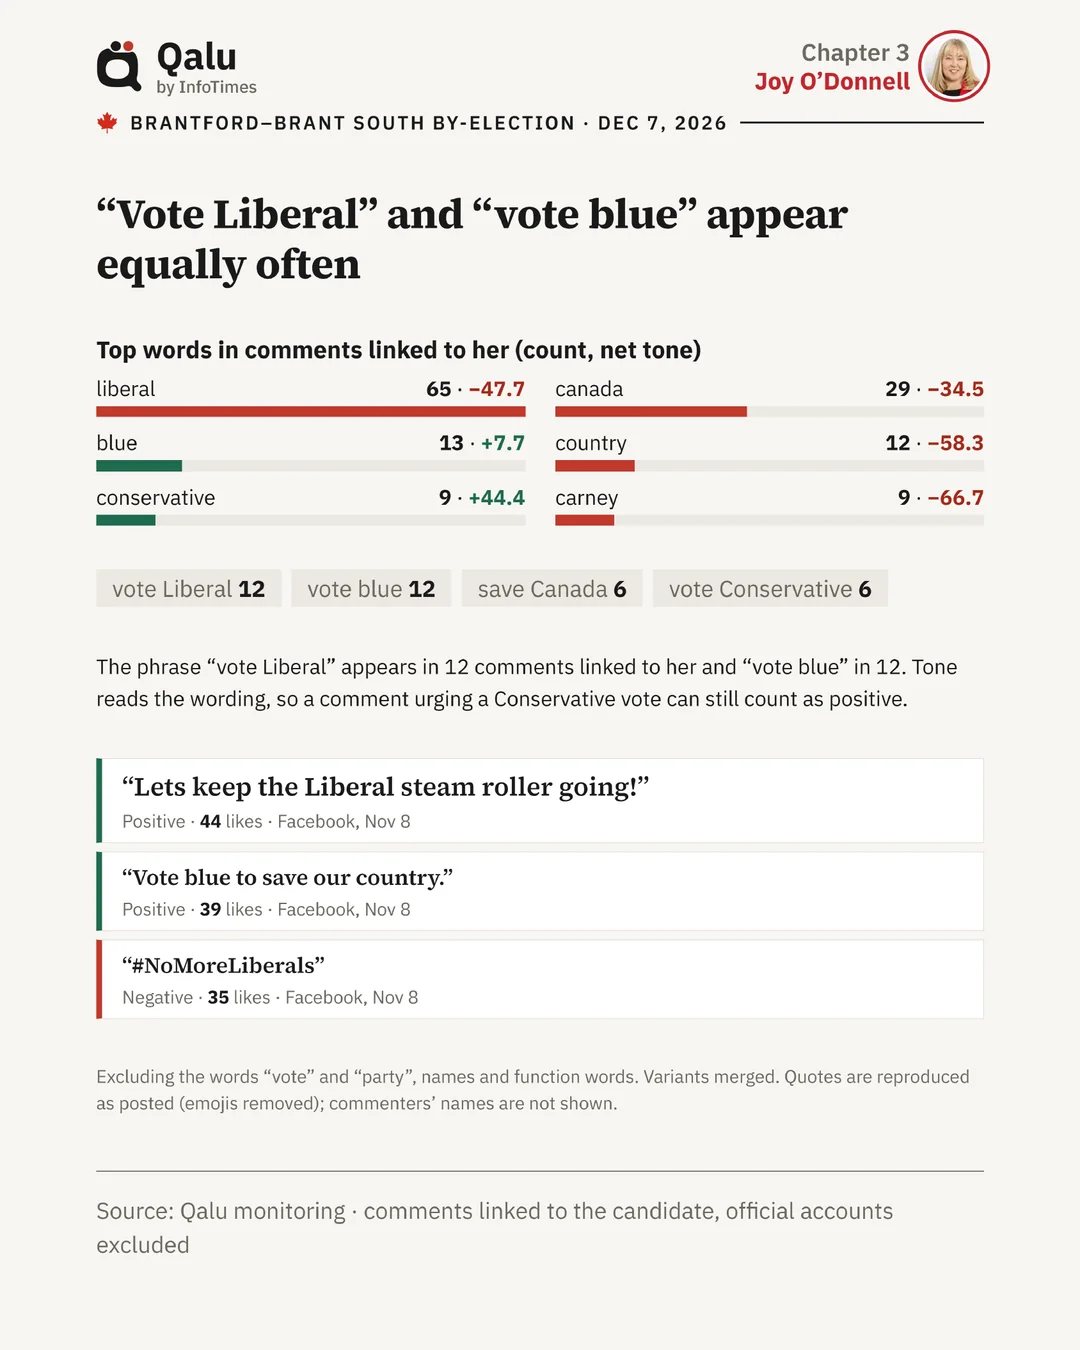
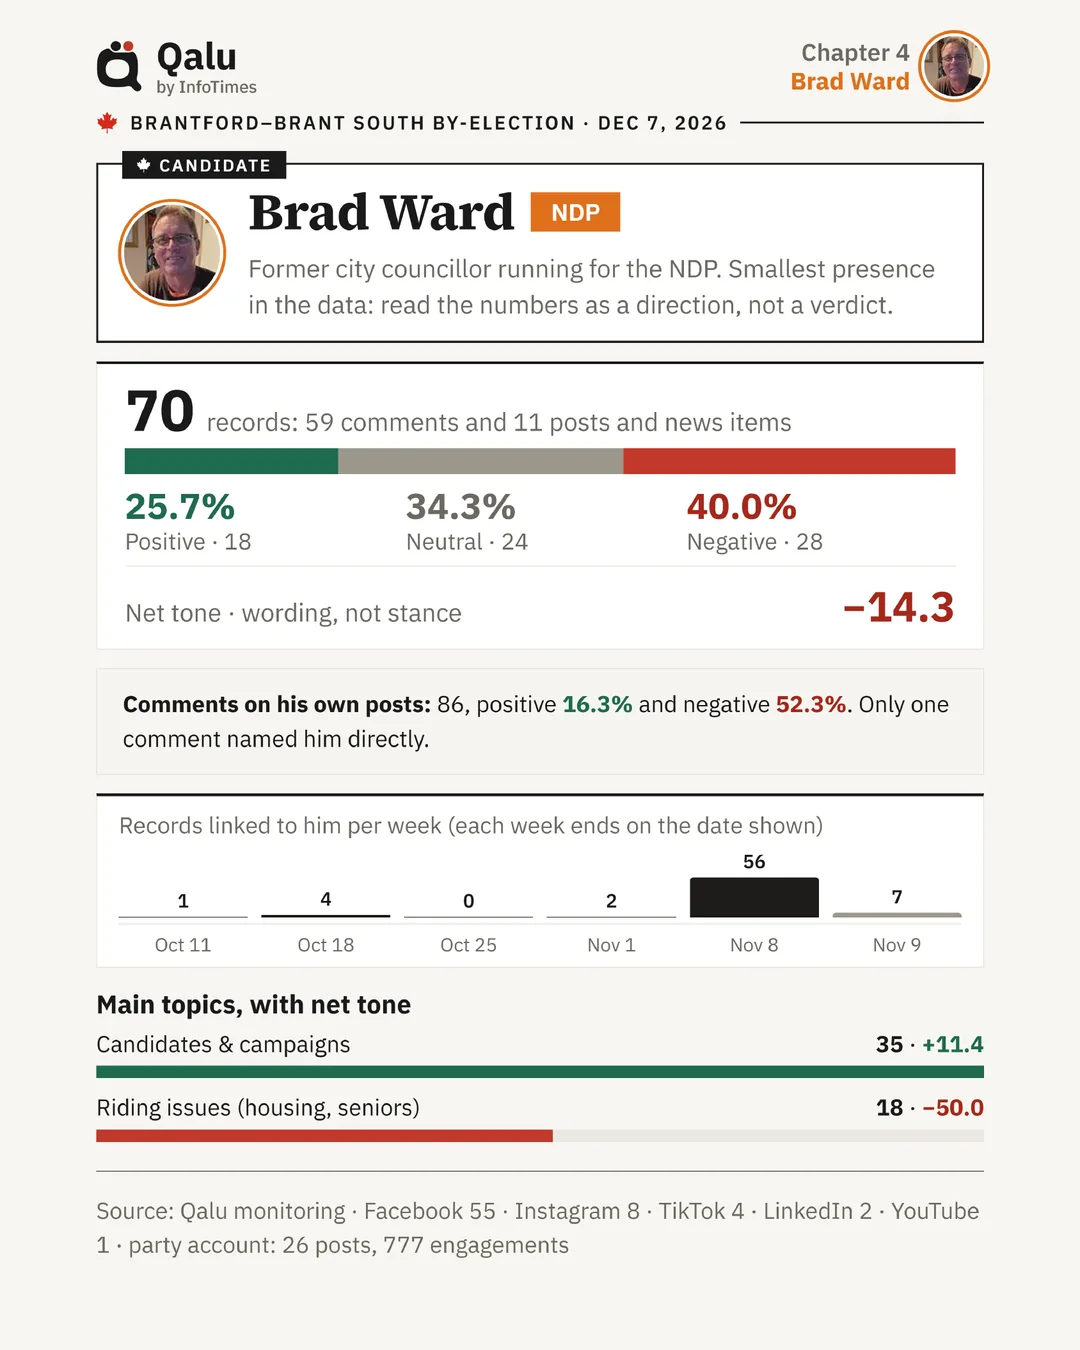
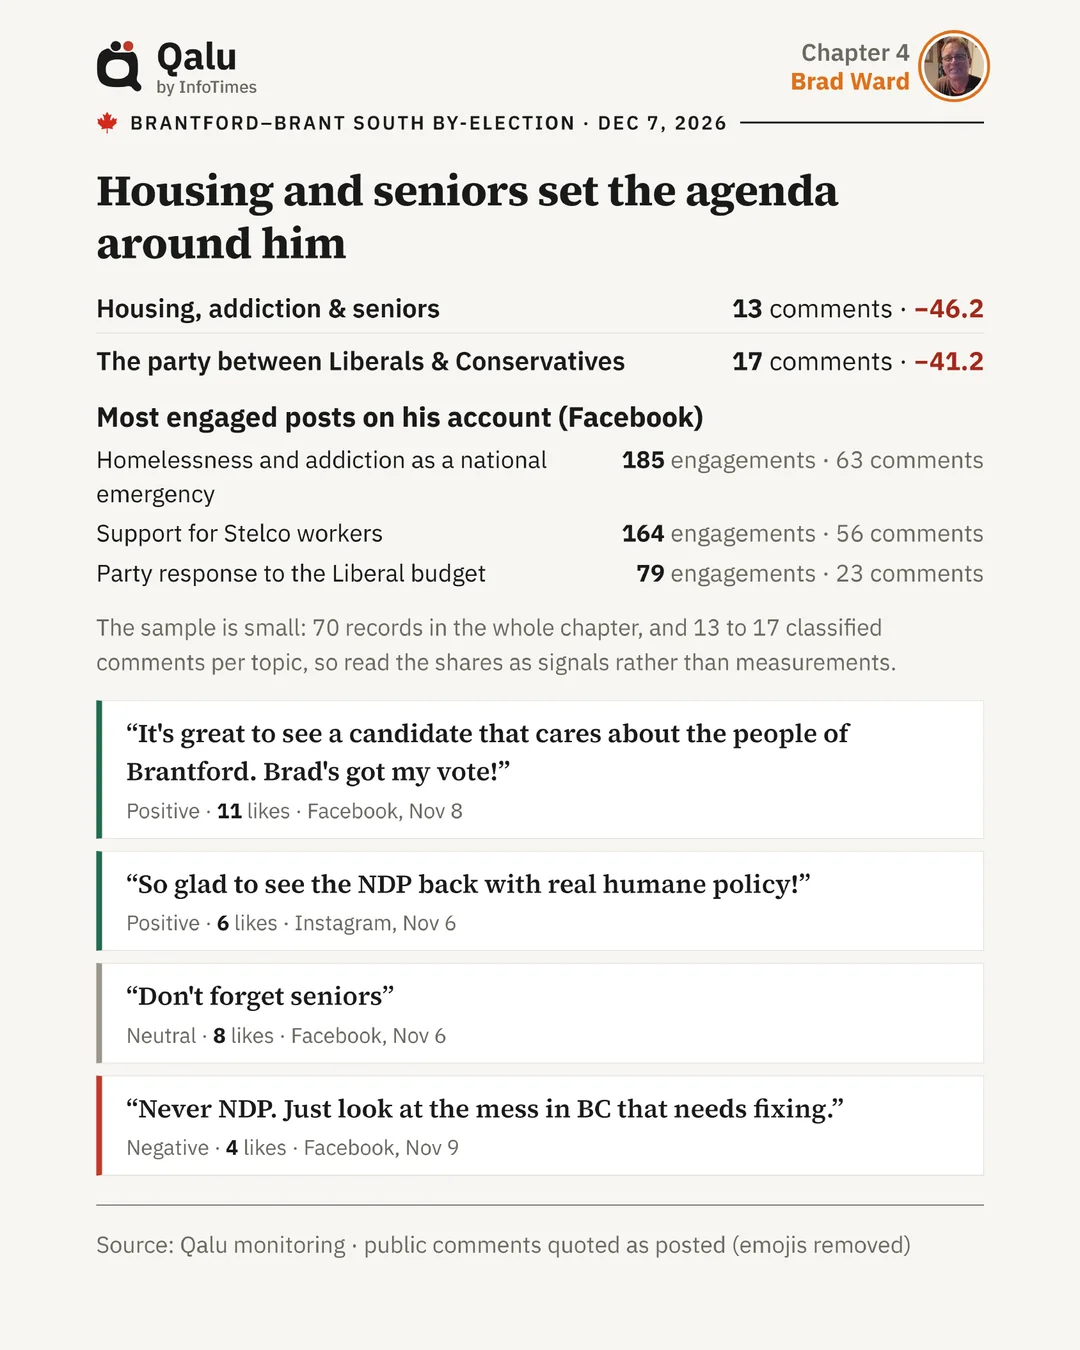
Thirty-eight slides, published on 9 November: the race as a whole, then each candidate in turn. The boards below are where the numbers come from.
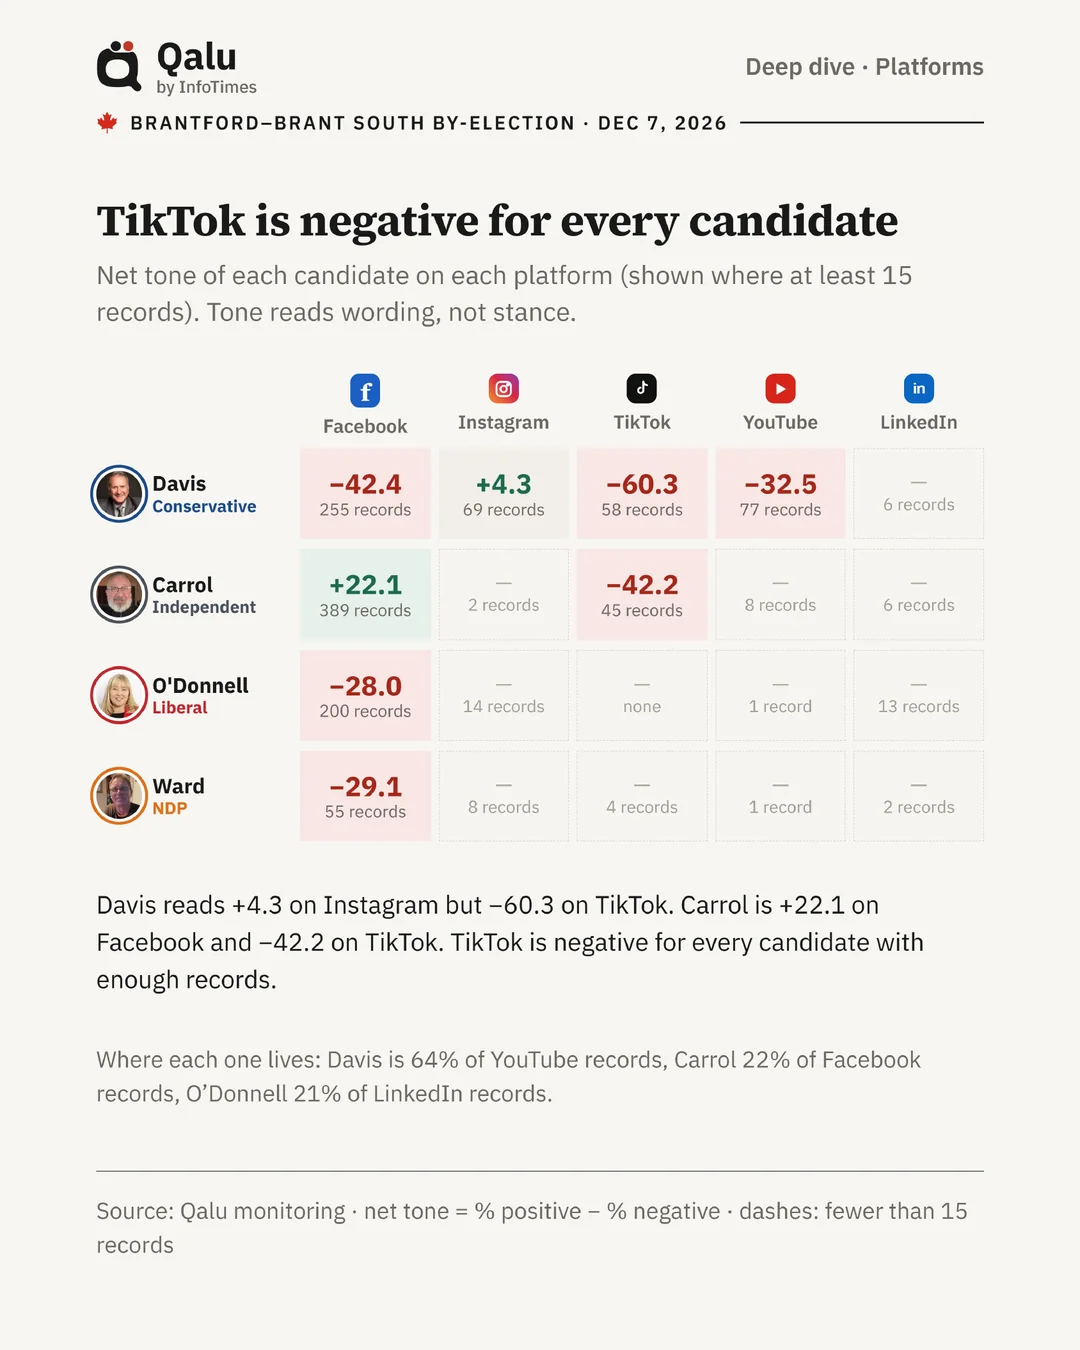
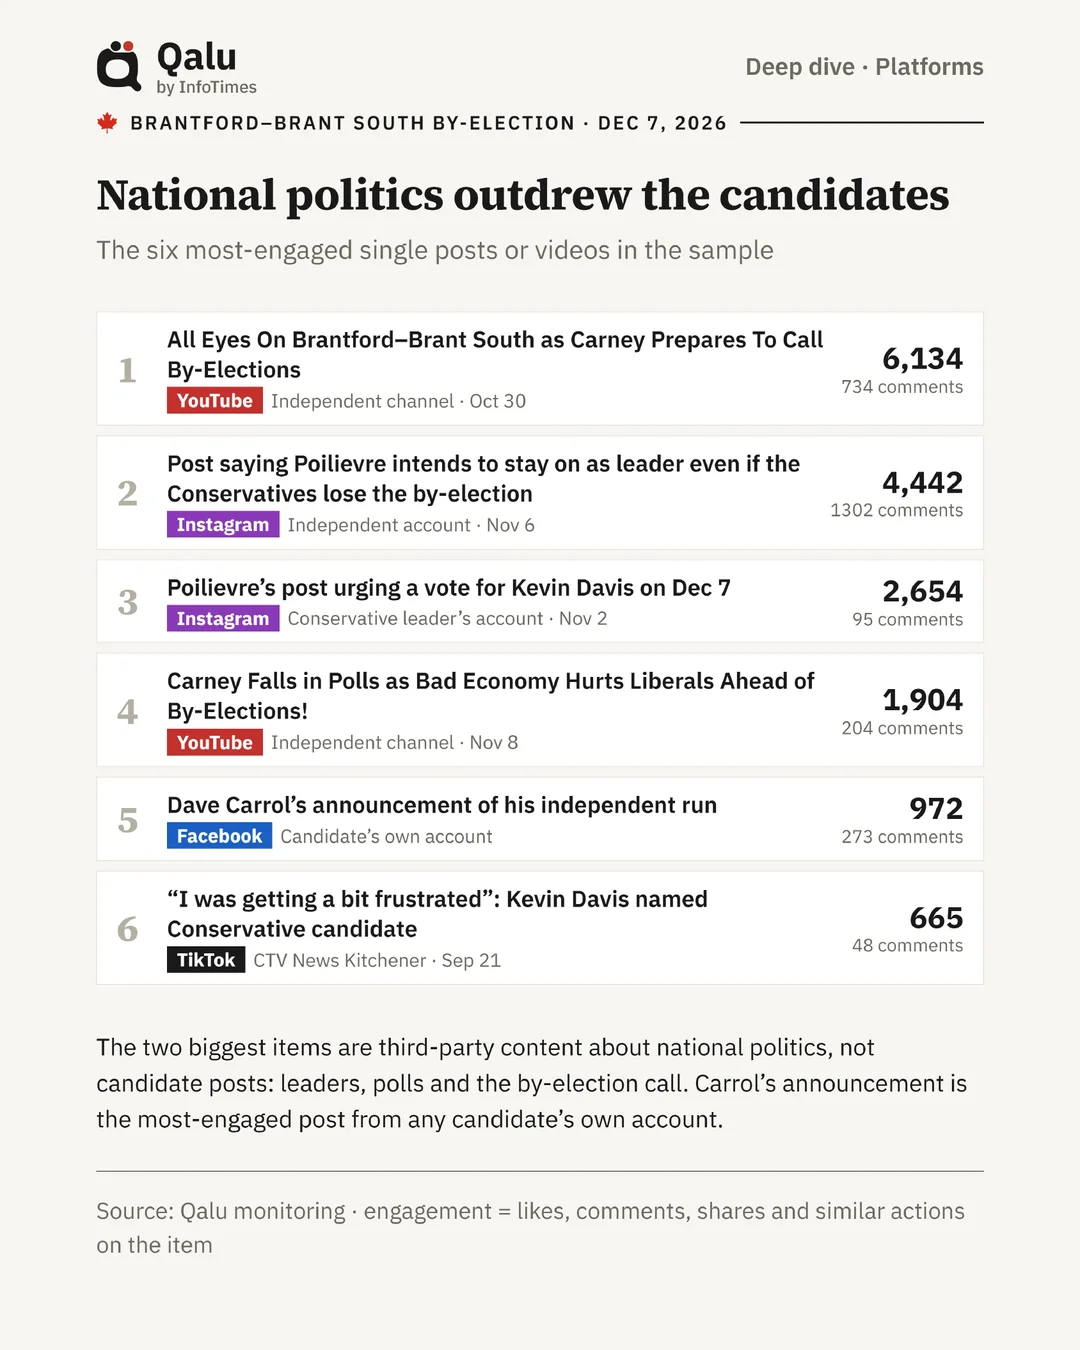
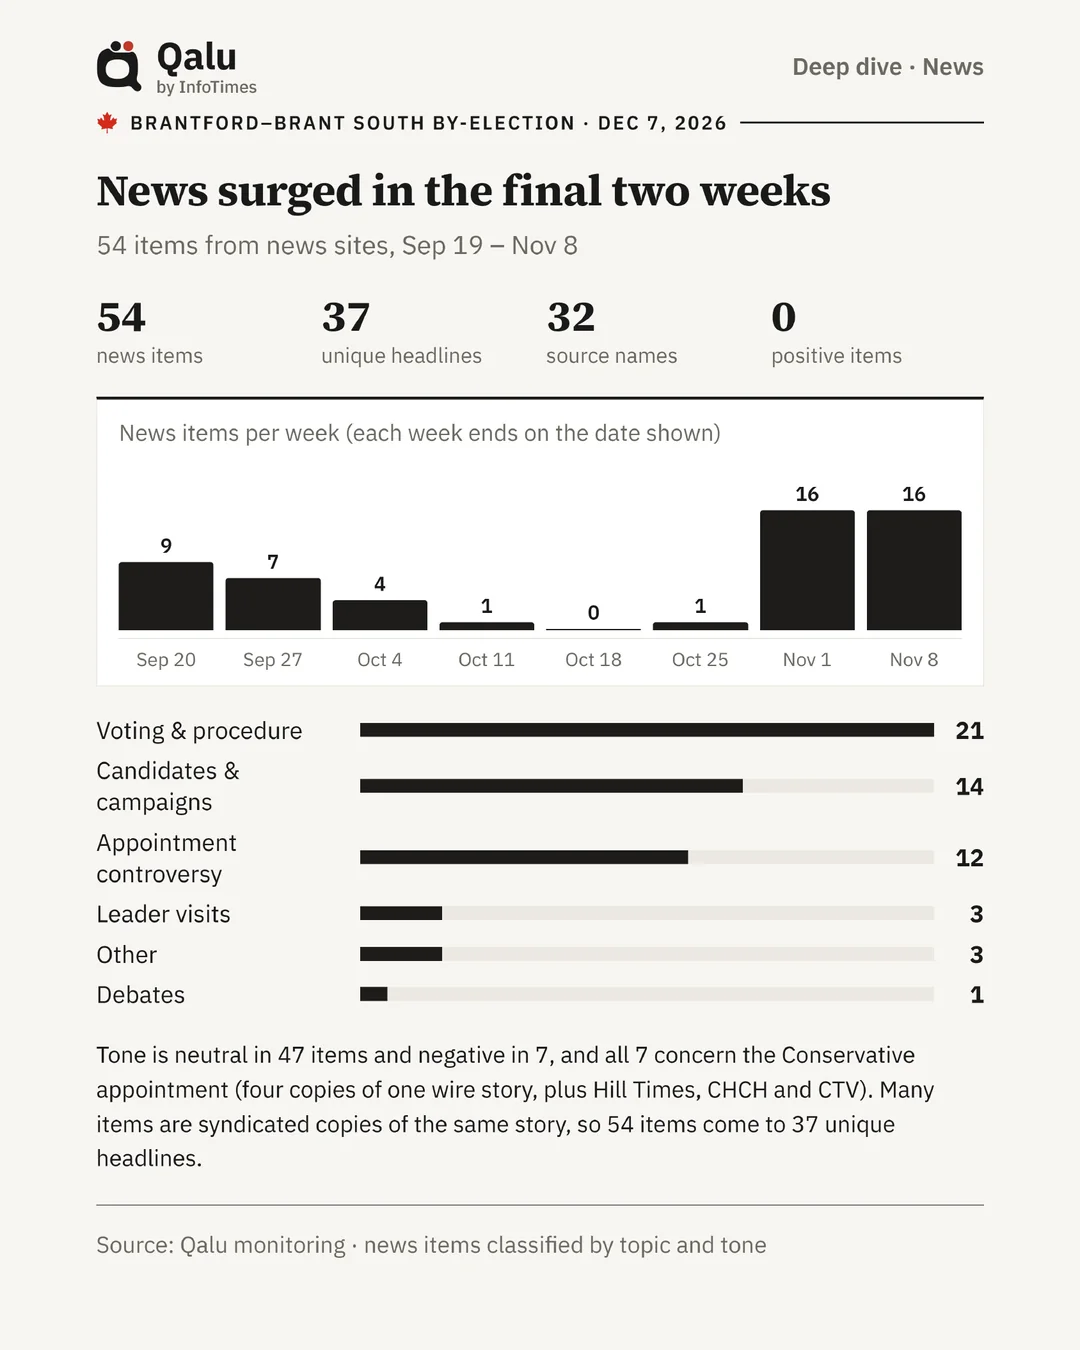
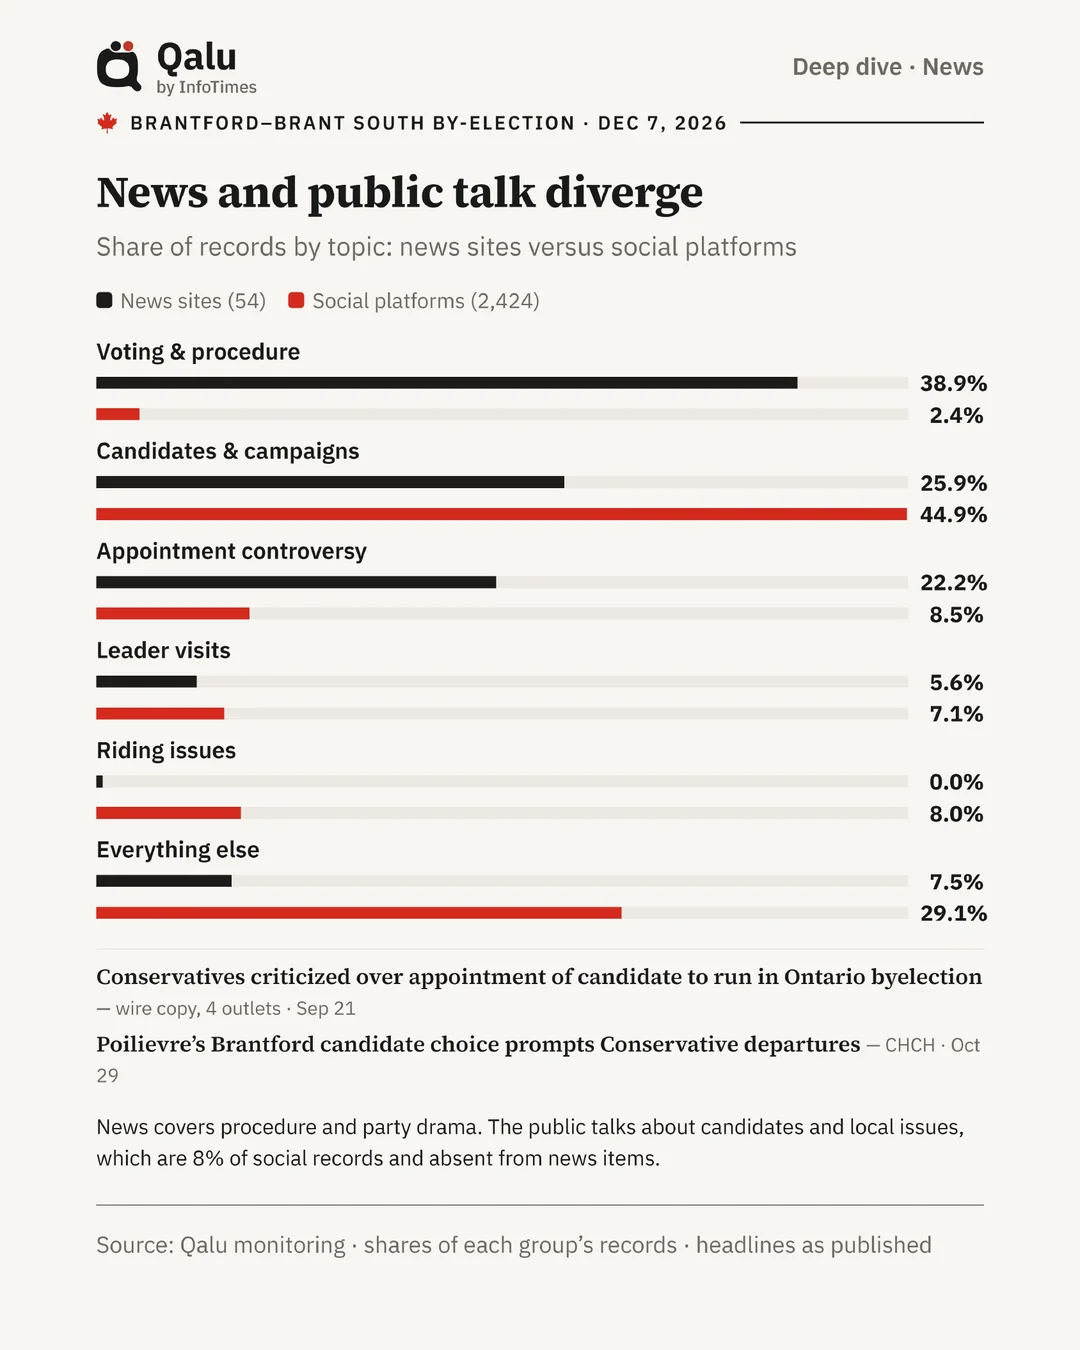
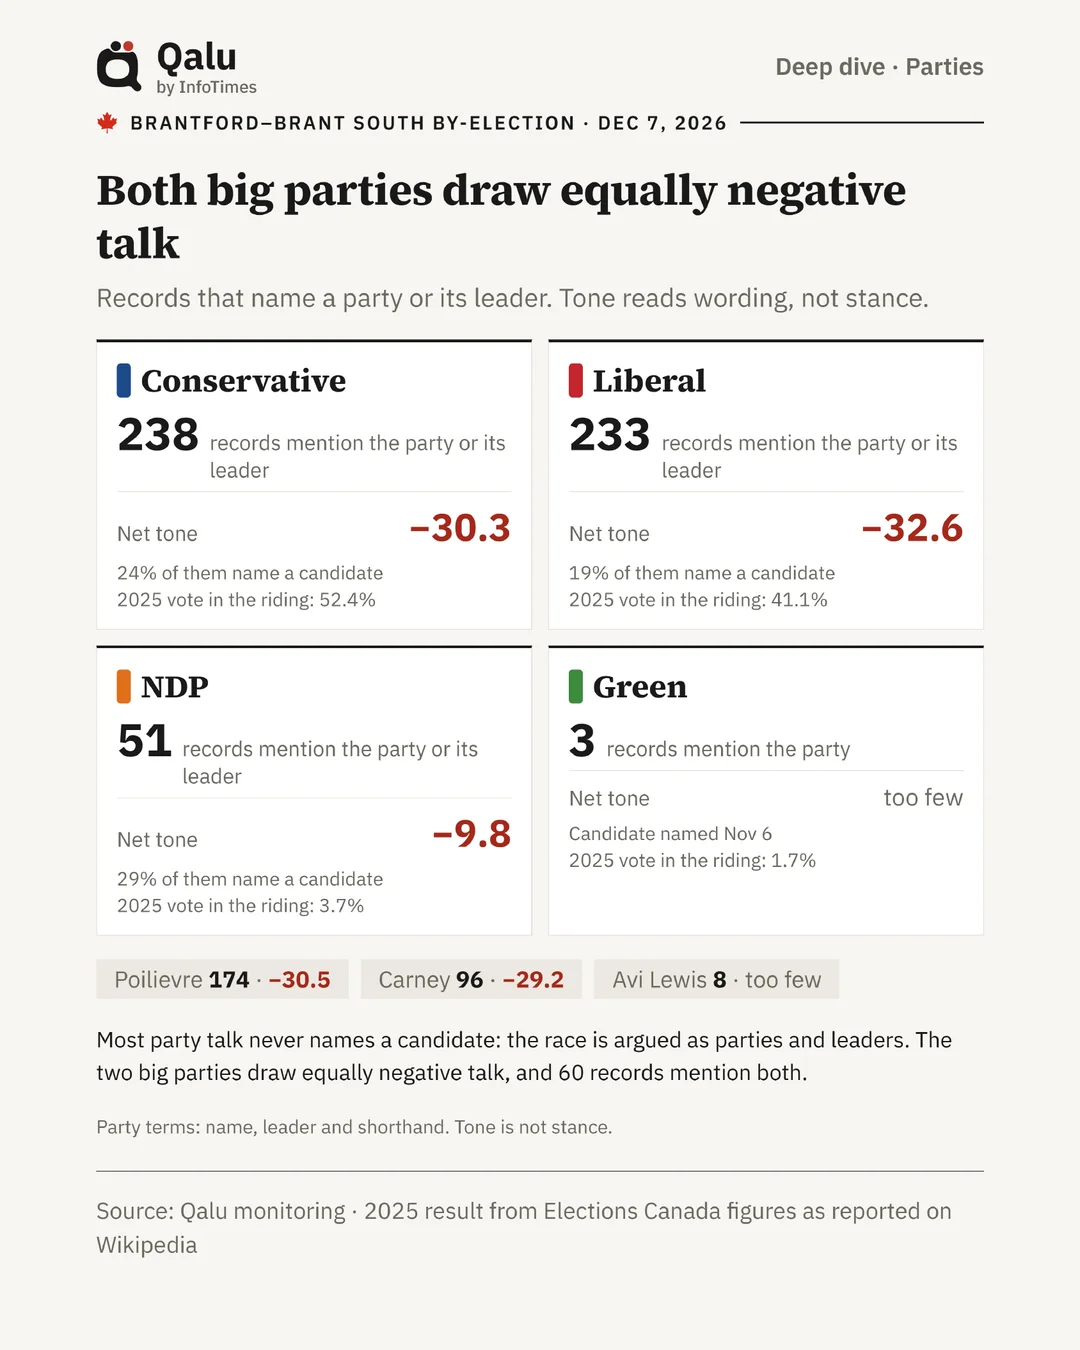
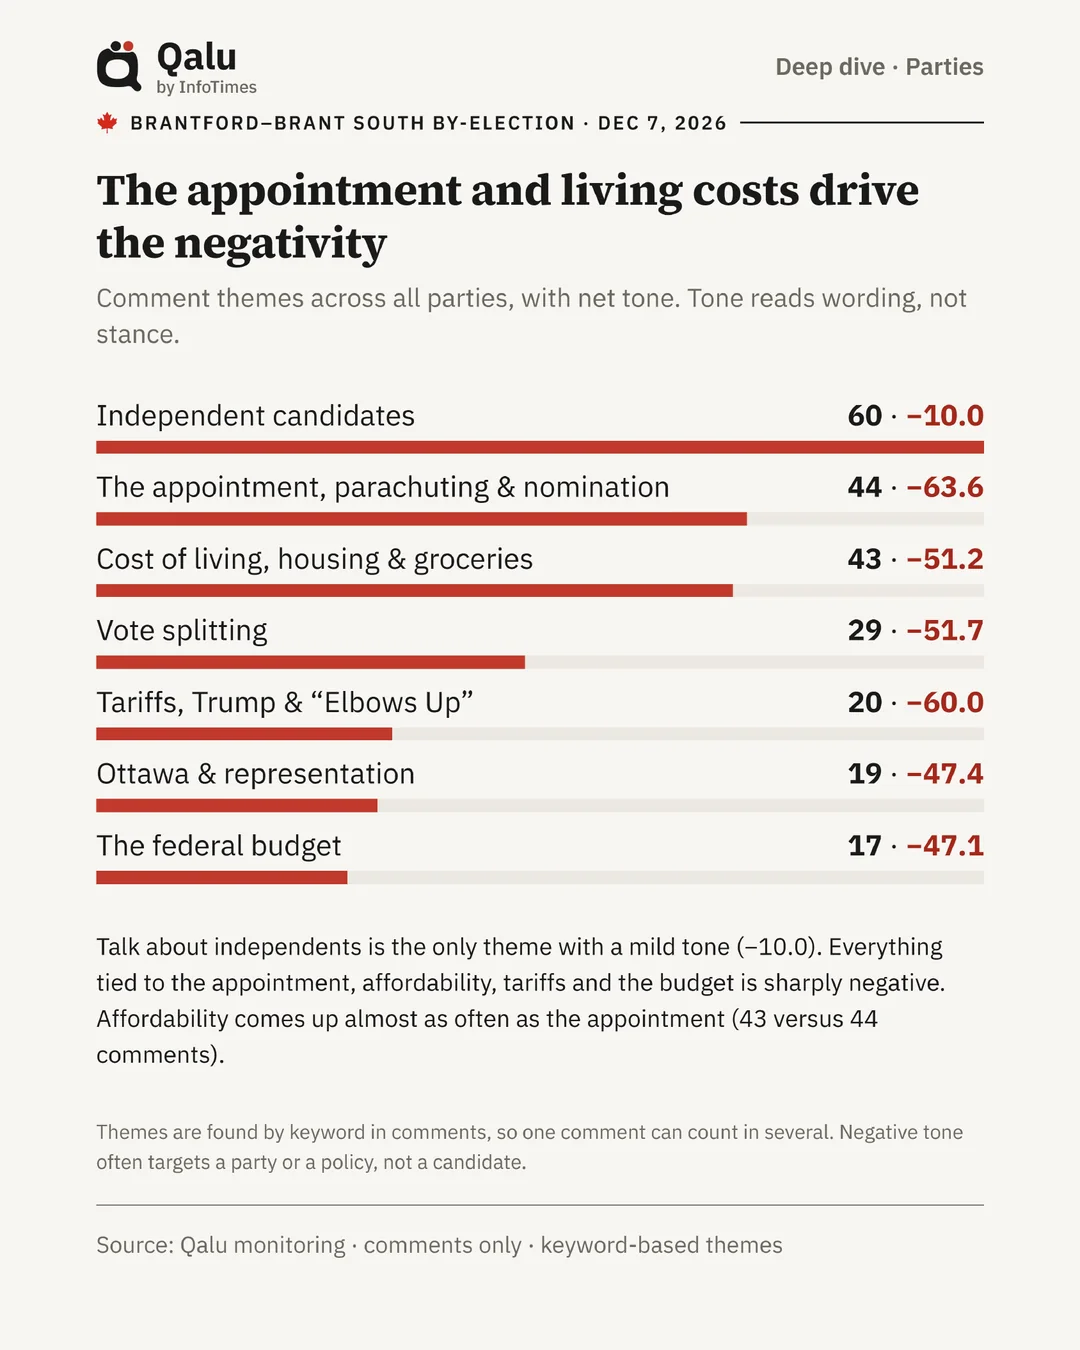
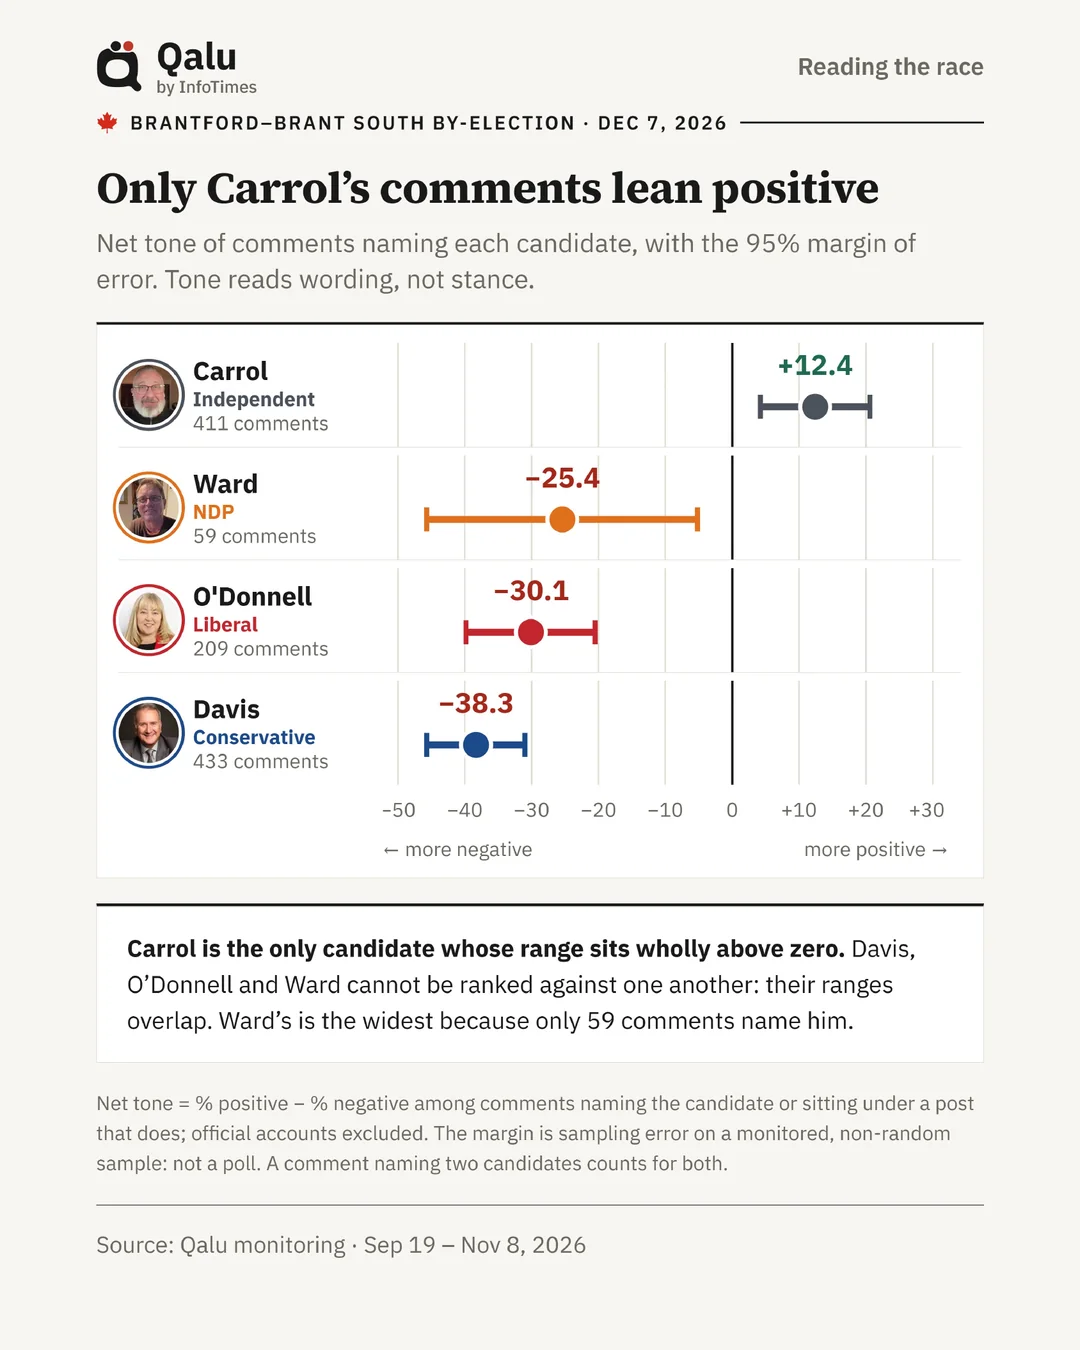
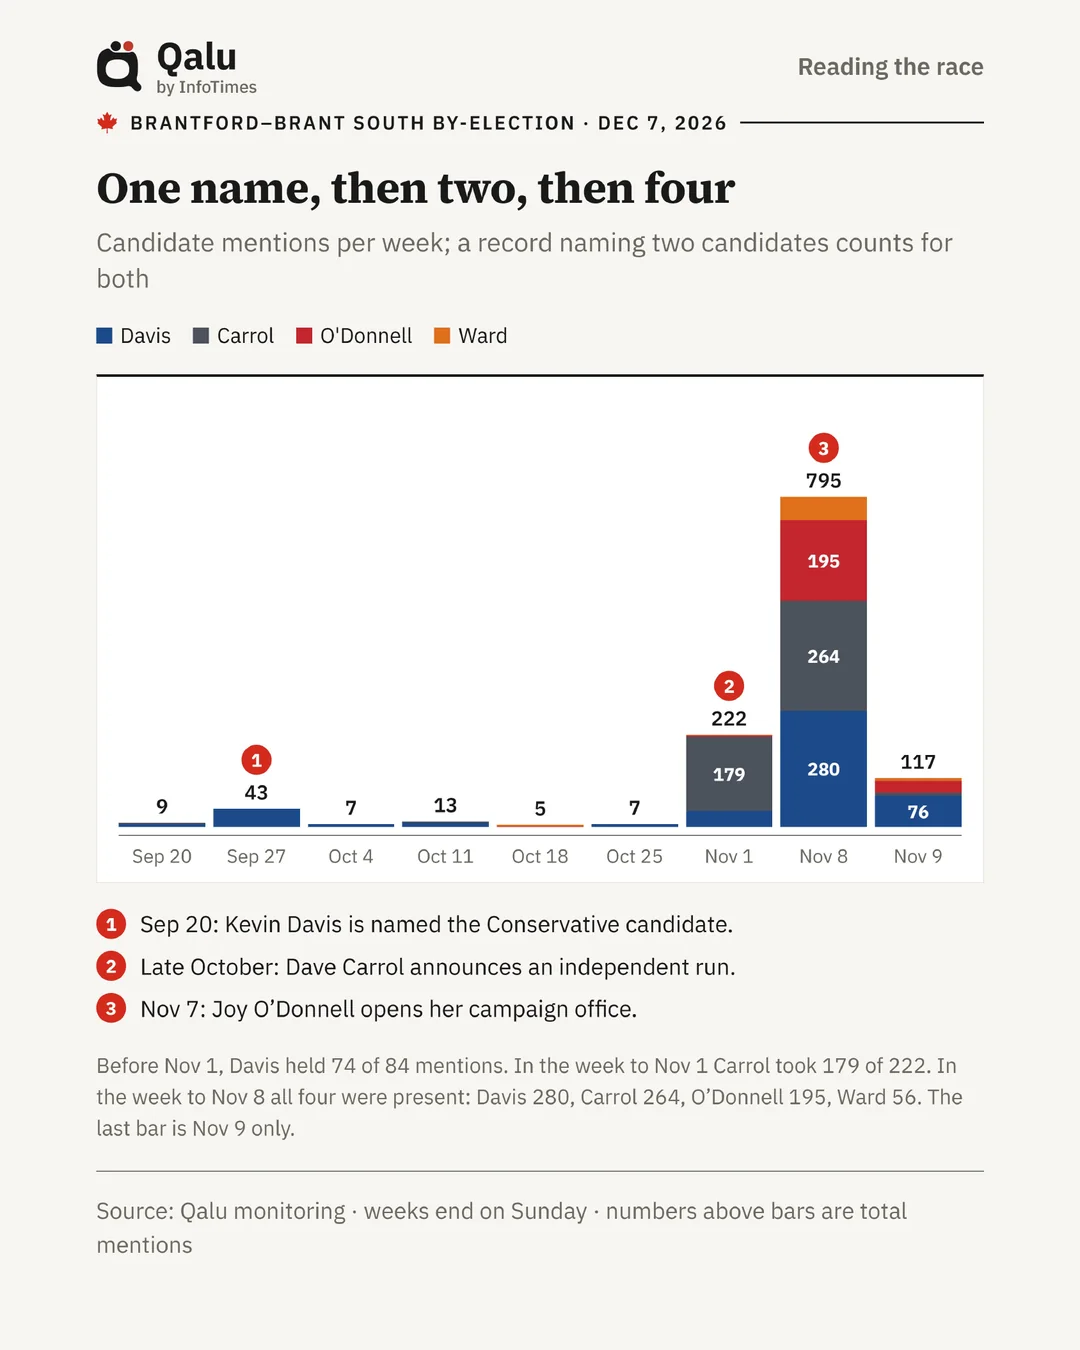
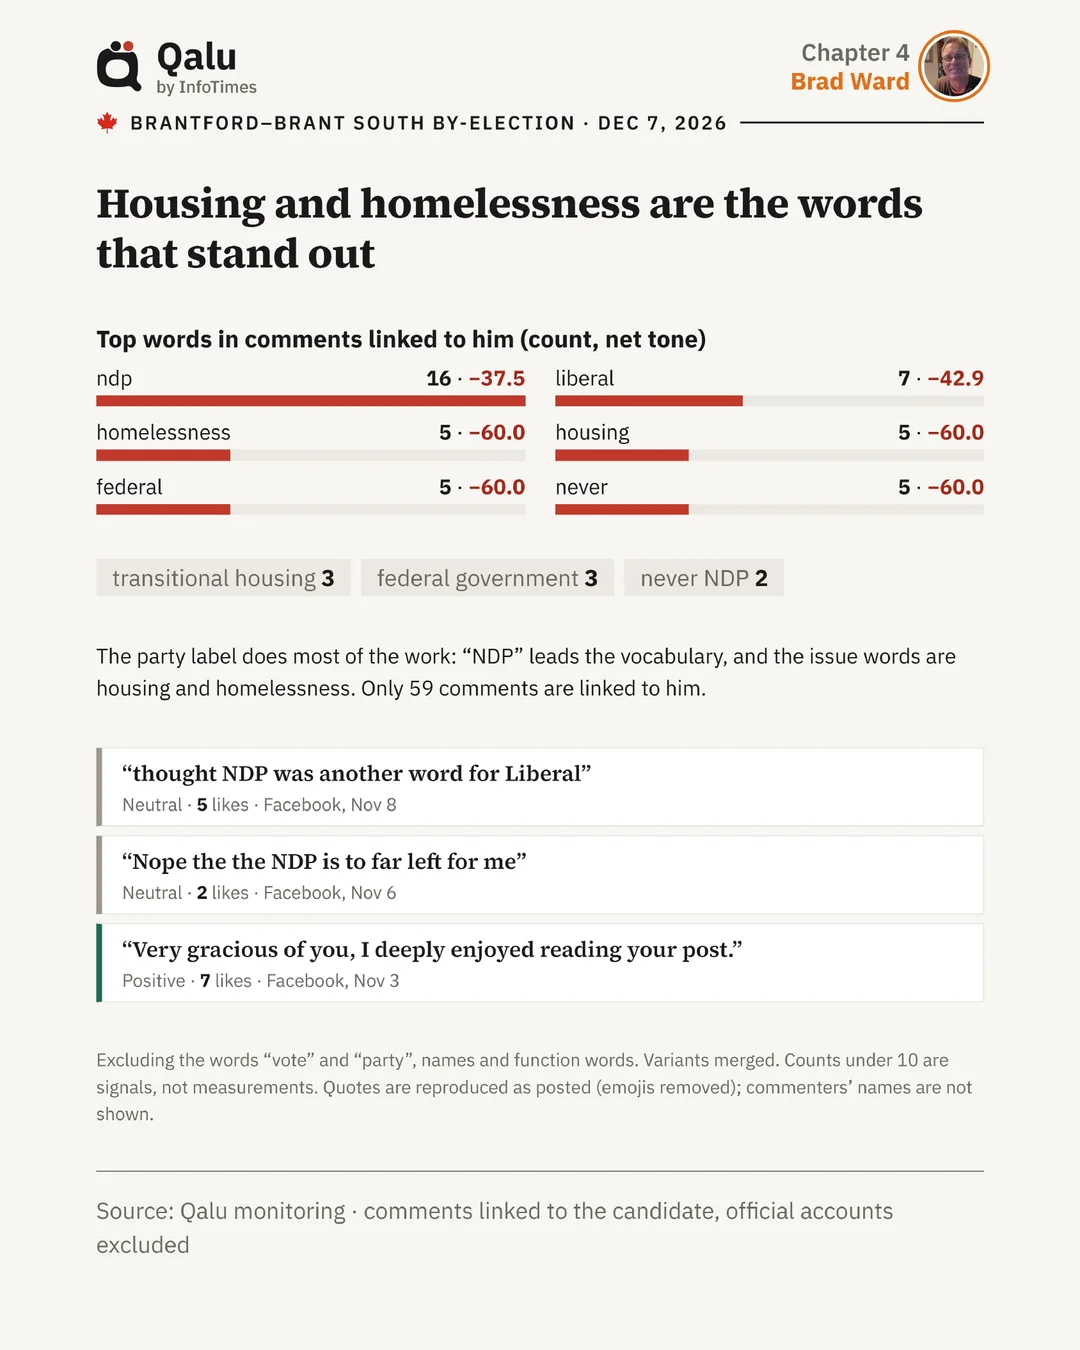
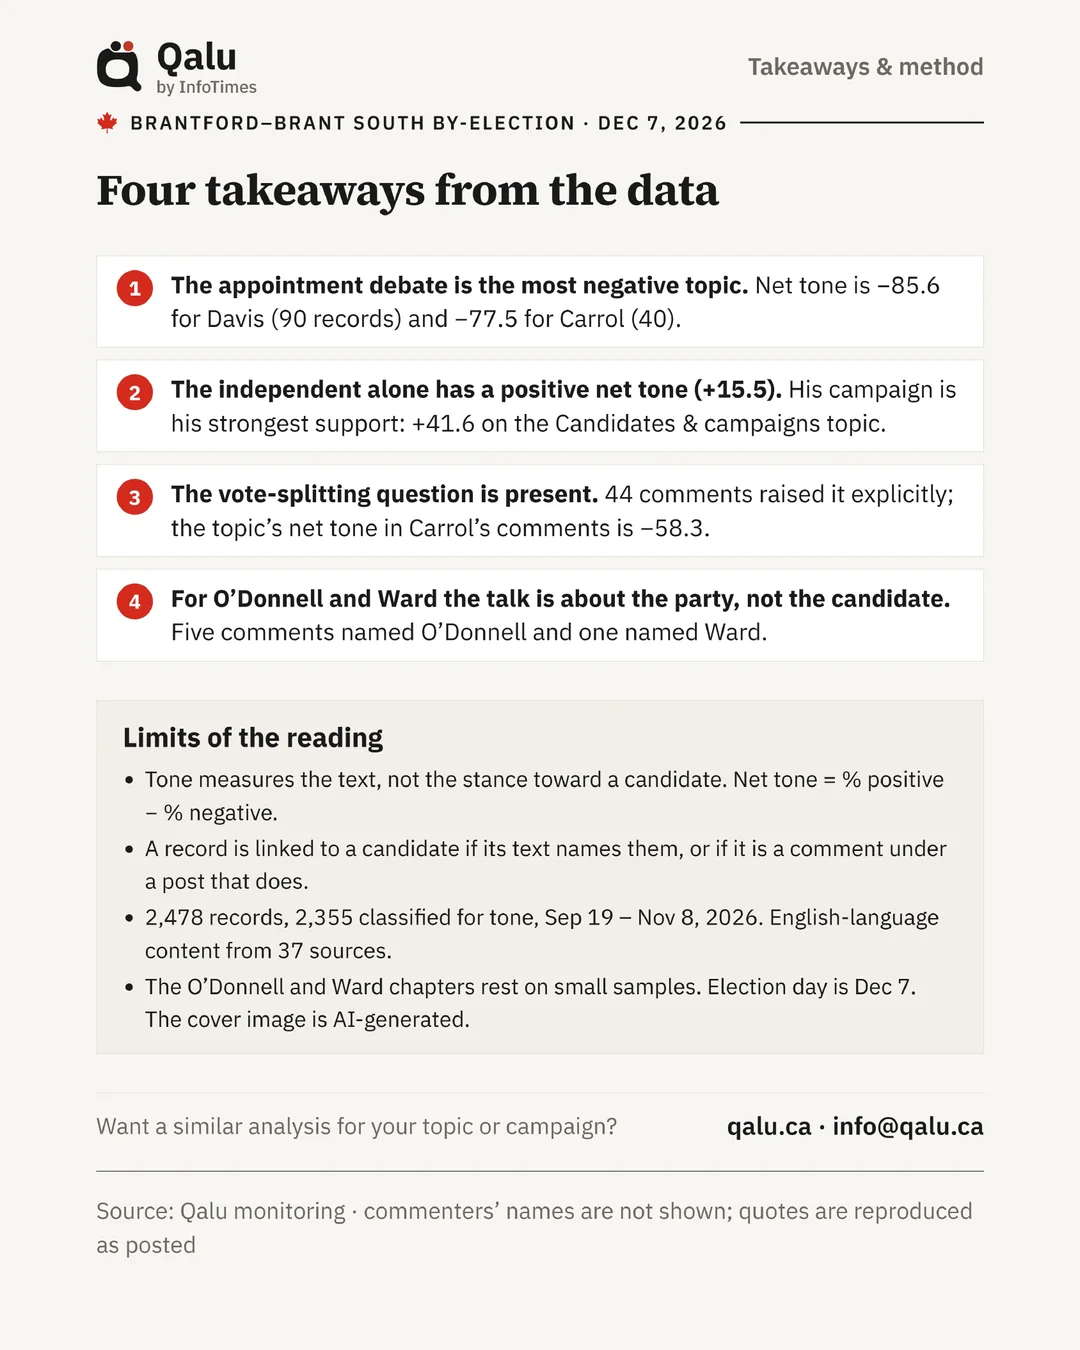
What is this race about, and where is it being argued?
A federal by-election is a small, local contest. National pollsters rarely survey a single riding, and local papers have thin newsrooms. Yet the people who live there talk about it every day, mostly online.
We wanted to know whether a monitored sample of that talk could show what the race is about, where it happens and when it heats up. We said so publicly at the start, and we will set what we saw against the result after the vote.
One riding, eleven sources, and a rule about place
The project searches news sites and ten social platforms for the riding’s names, the by-election and the candidates, from 18 September to polling day.
Candidates’ names are common names. On their own they would pull in strangers from across the country, so every record must also mention Brantford or Brant. Only seven records were thrown out as unrelated.
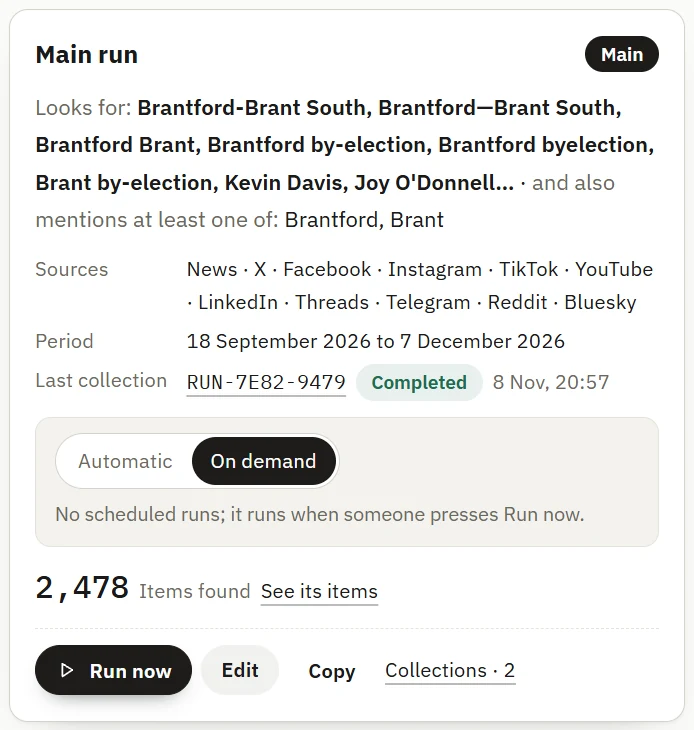
- A The place rule: a record counts only if it also says Brantford or Brant.
- B News sites plus ten platforms, from X and TikTok to Reddit and Bluesky.
A conversation held in the comments, on Facebook
Nine records in ten are comments: 2,174 of 2,478. The race is argued under posts, not in them. News sites supplied only 54 records.
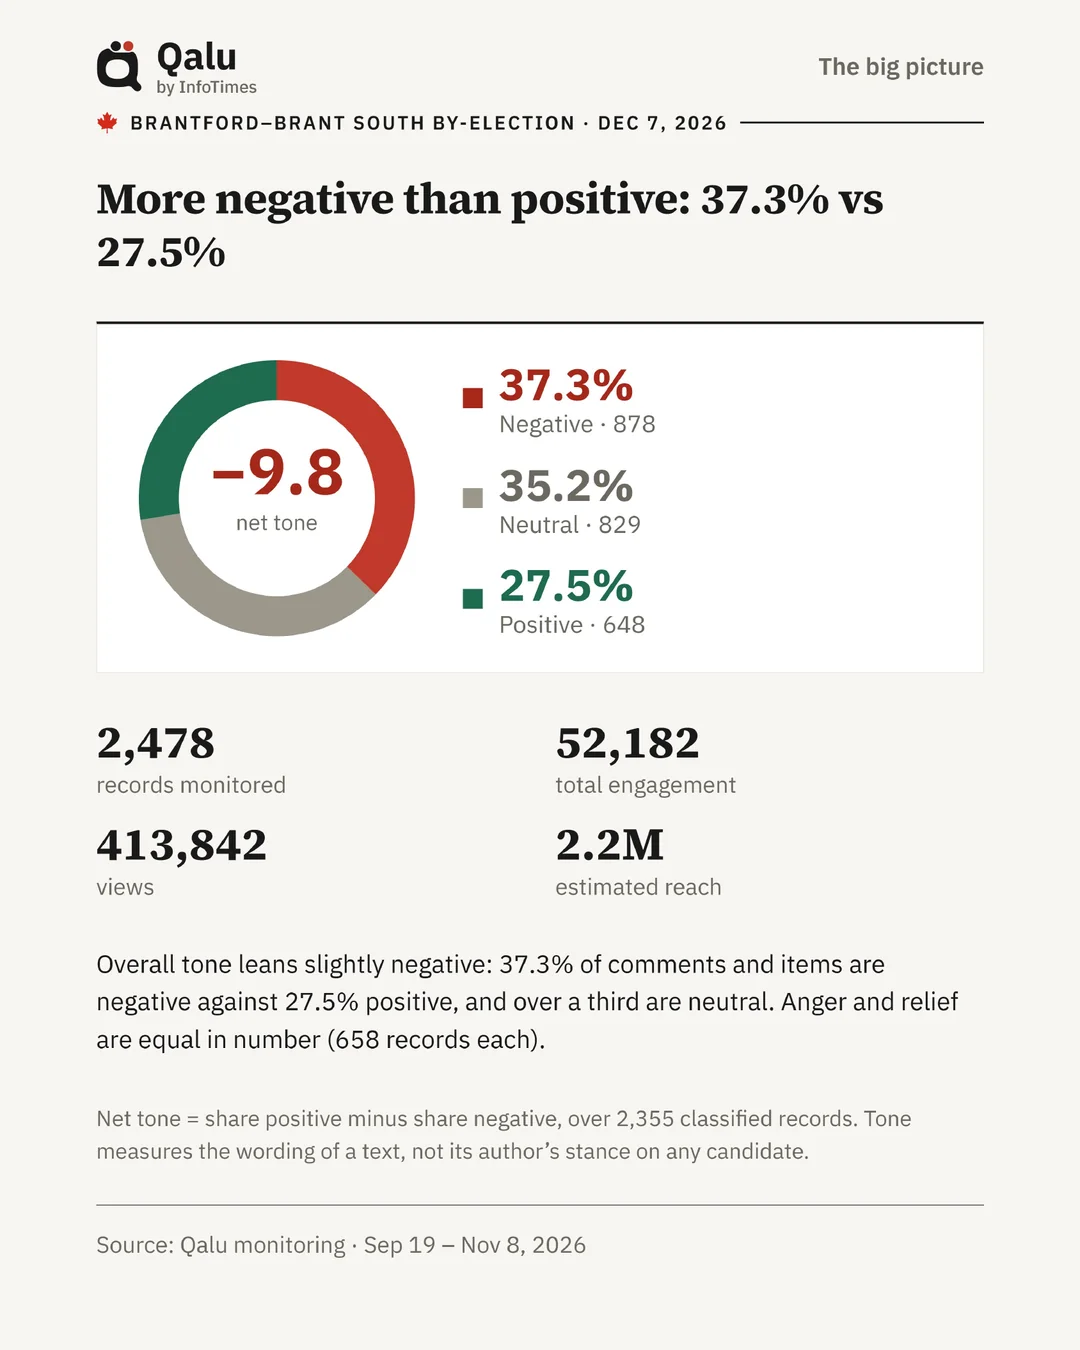
The tone leans negative, as campaign talk usually does: 37% of classified records against 28% positive. Tone measures wording, not voting intention.

- A 304 posts and articles, 2,174 comments.
- B Negative outweighs positive. That is wording, not votes.
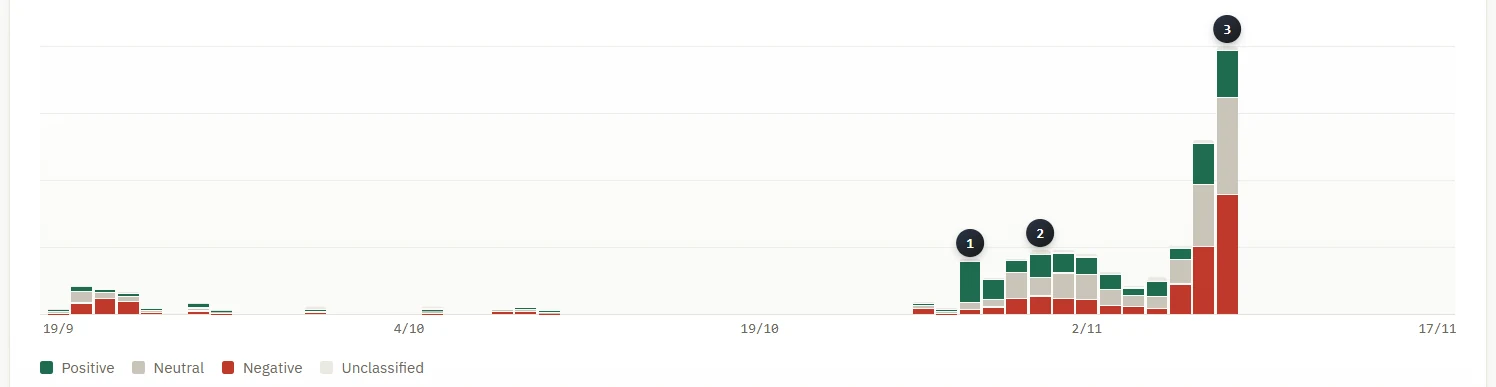
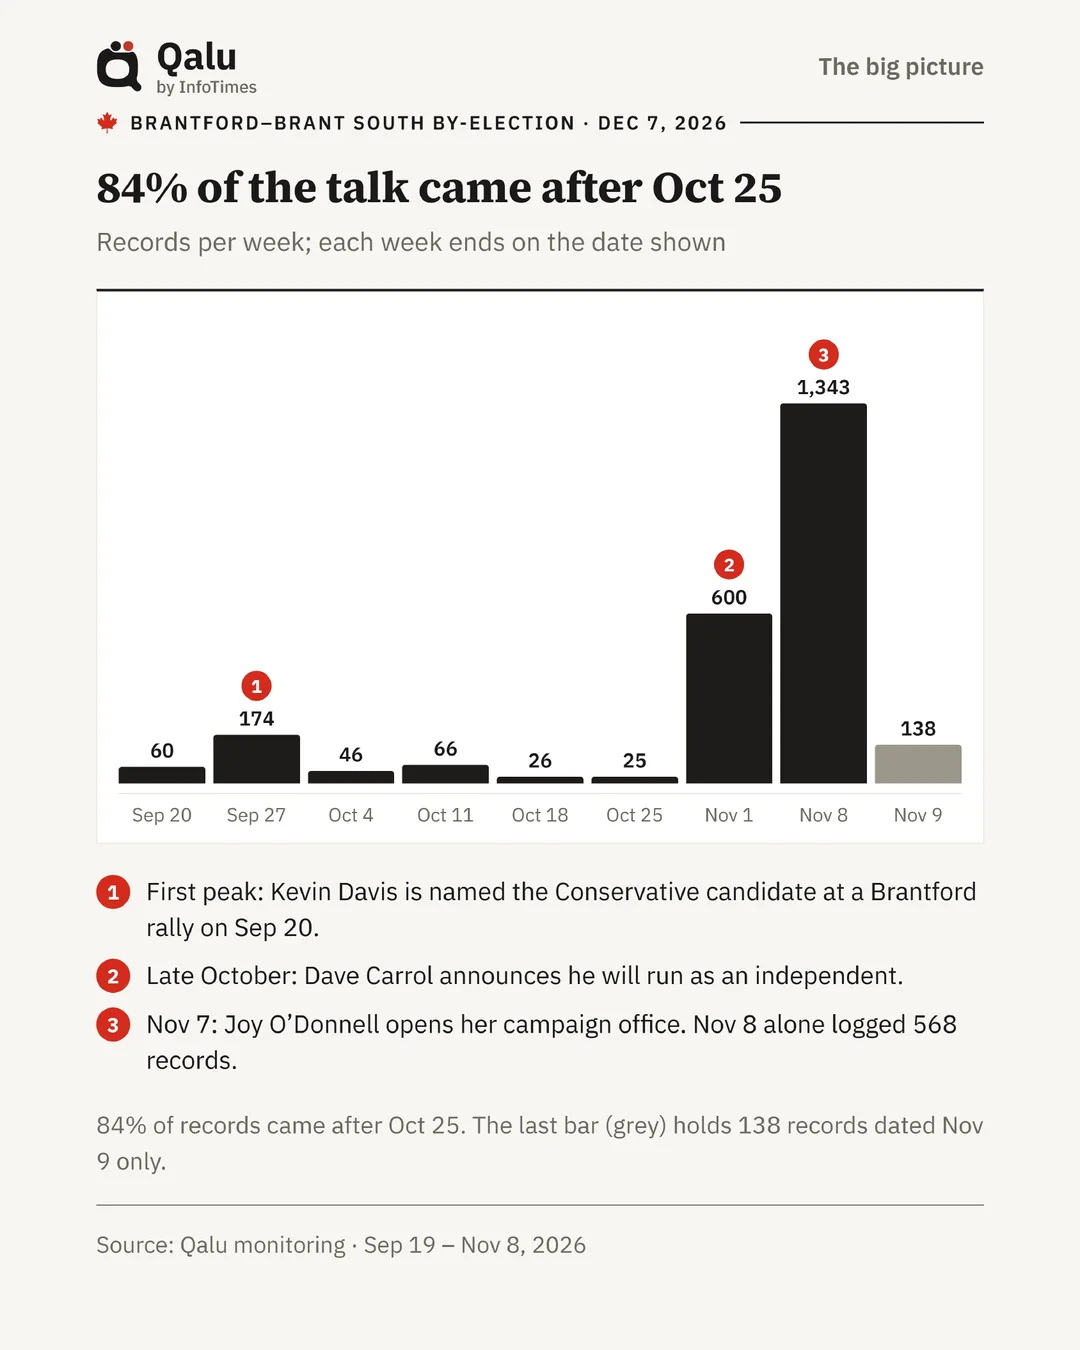
- A 28 October: the race wakes up, 117 records in a day.
- B 8 November: 574 records, the busiest day so far.
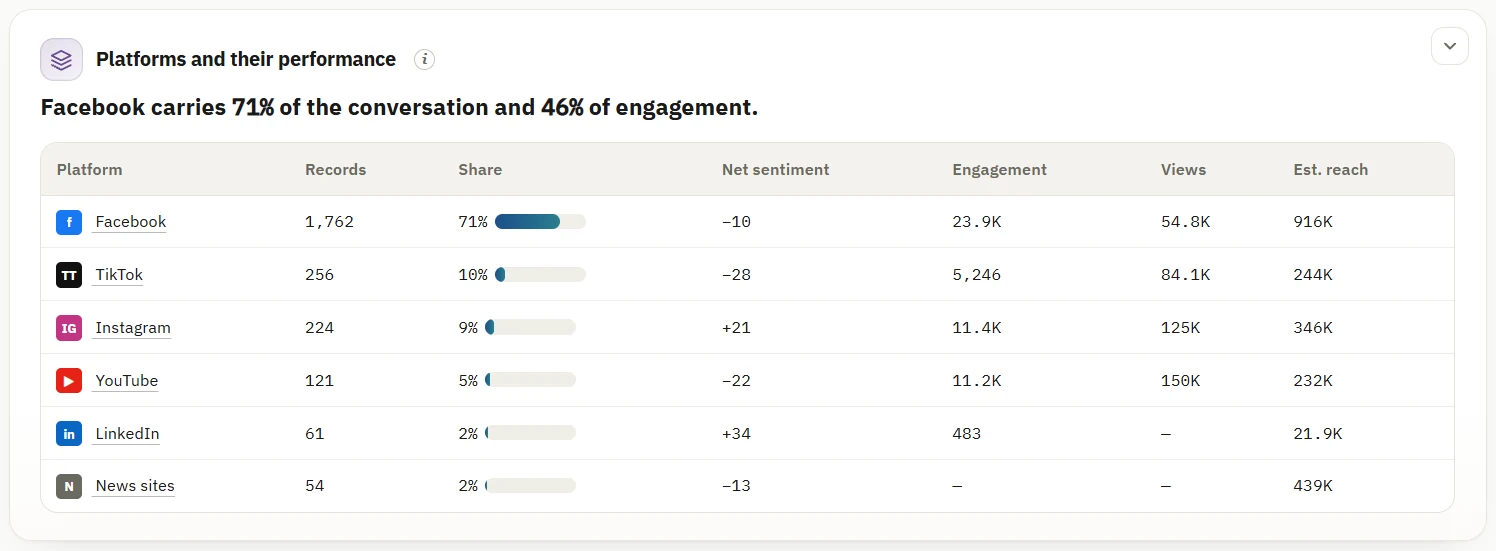
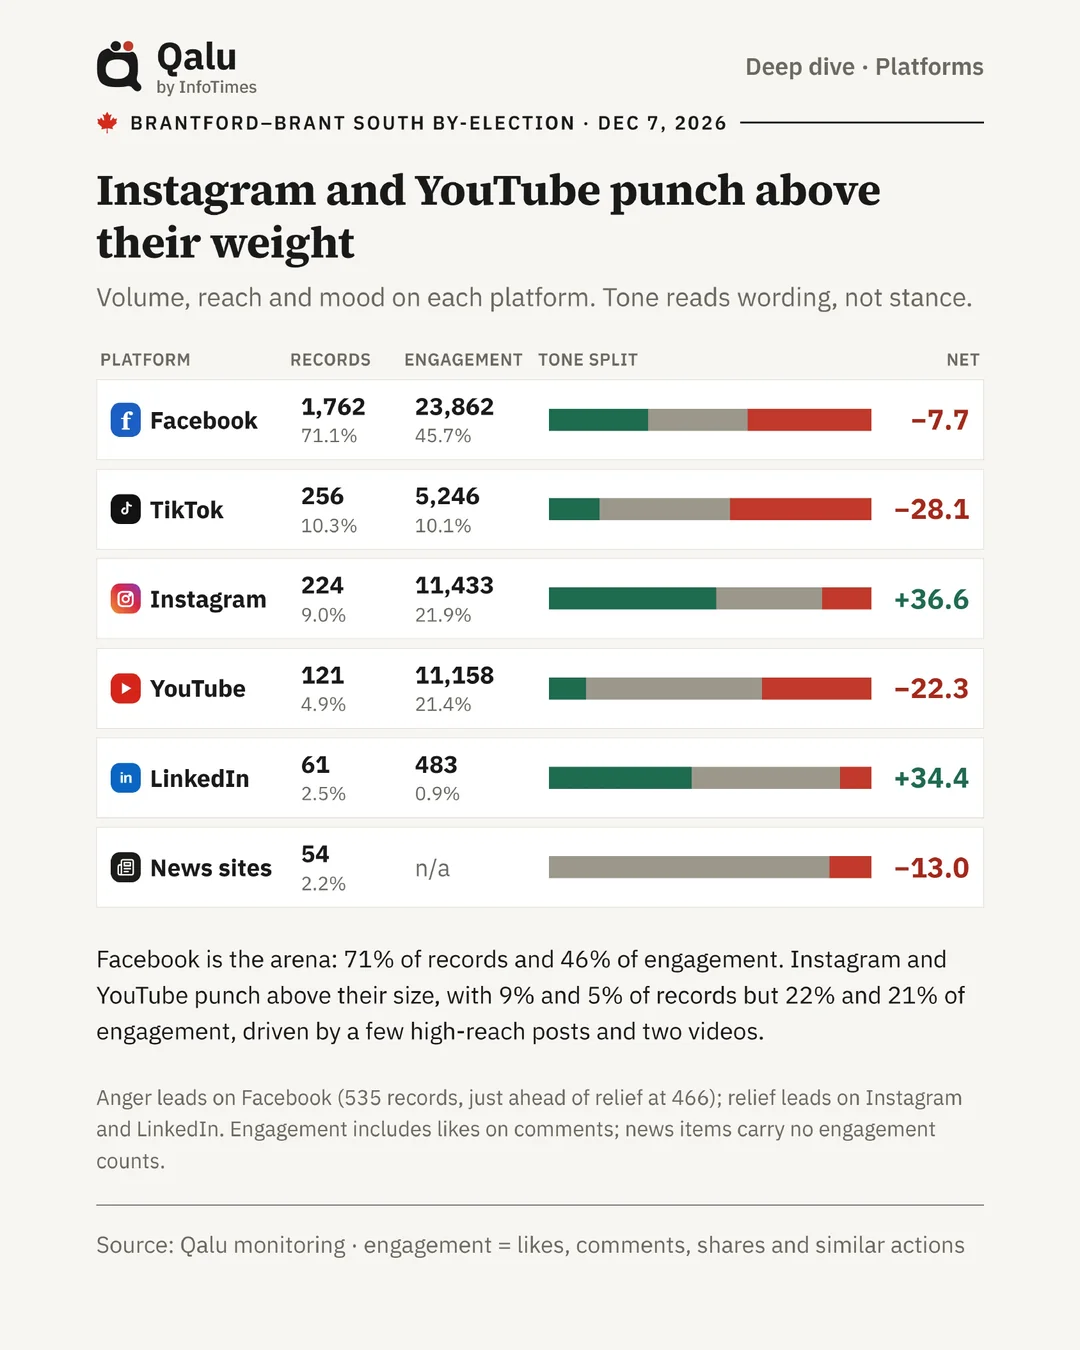
- A Facebook carries 71% of the records and 46% of the engagement.
- B Instagram and YouTube: fewer records, more views than Facebook.
What it adds up to
The race lives on Facebook
1,762 of the 2,478 records came from Facebook. A campaign that ignores it is absent from most of the local conversation.
The talk began late
For a month the riding was almost silent. It woke on 28 October and peaked on 8 November with 574 records.
Candidates first, issues second
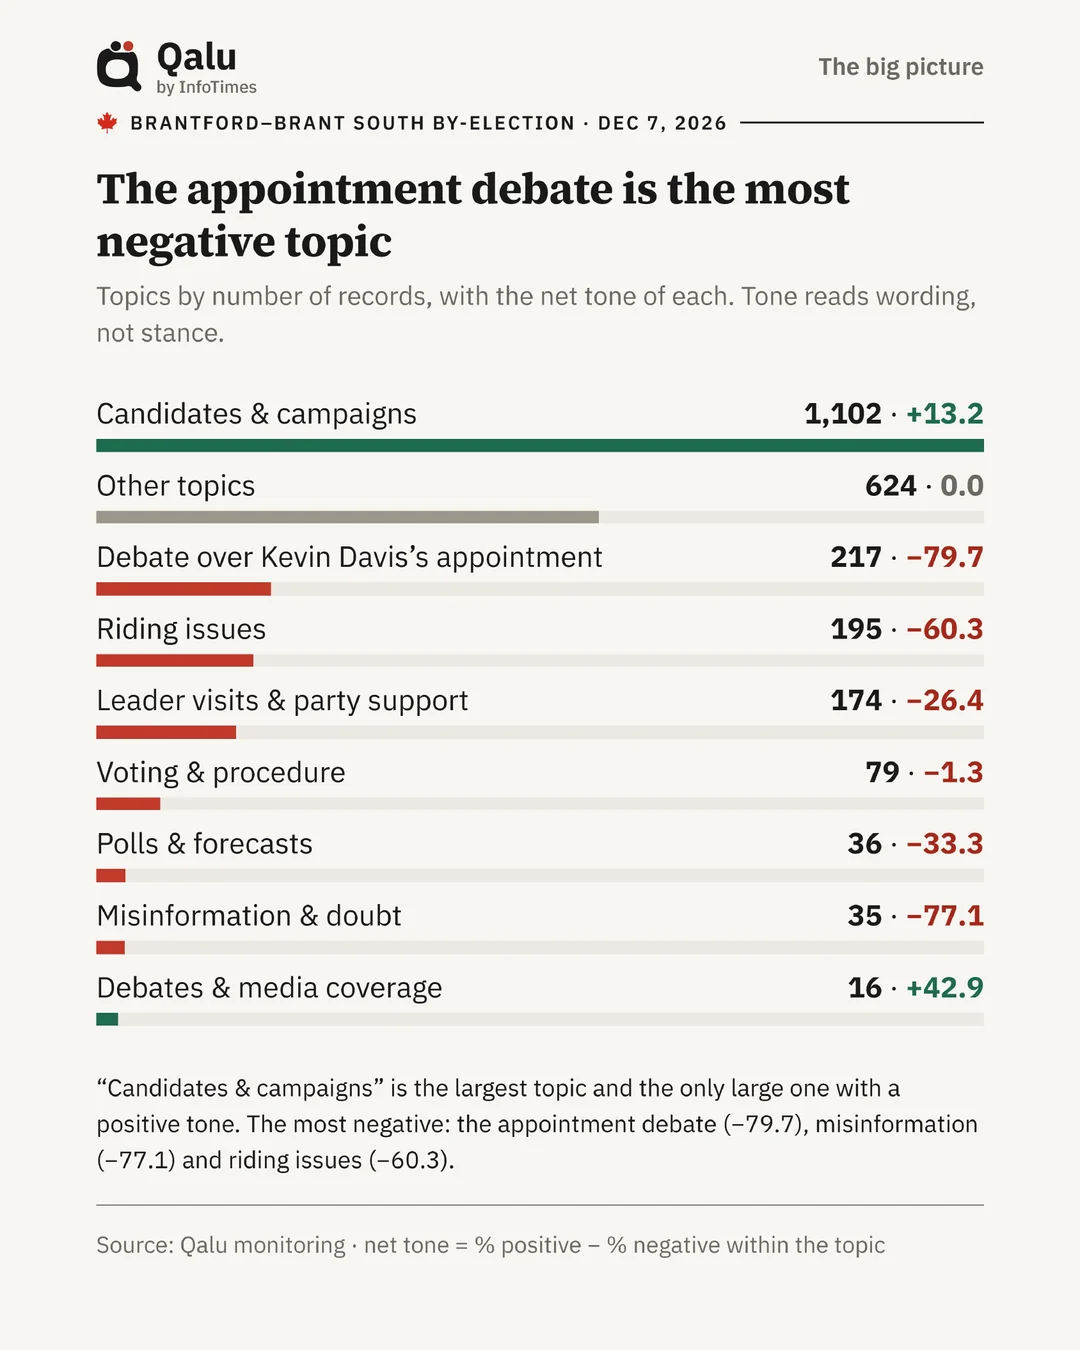
Candidates and campaigns account for 1,102 records; local issues for 195; leaders’ visits for 174; voting procedures for 79; polls for 36.
Have a question like these?
Tell us what you need to follow. We will show you the search, the board and the report on your own subject.